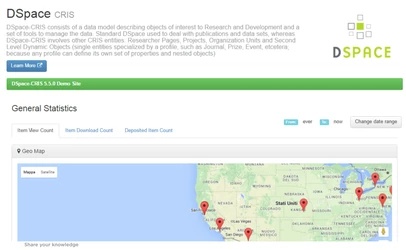
1) Statistics available at all levels of hierarchy, including the whole repository
Thanks to this feature you can have at any give time an overview of all the contents collected by the system.
For example who's viewing and downloading it:
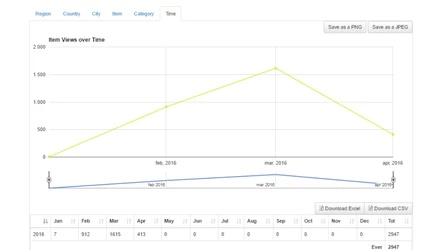
Or the aggregated information about the trend of viewing and downloading over time:
Or again what are the different type of contents collected by the system

2) Global & Top item views & downloads
Information about views and downloads automatically feed the dynamic components in the system, so to always have up to date information:

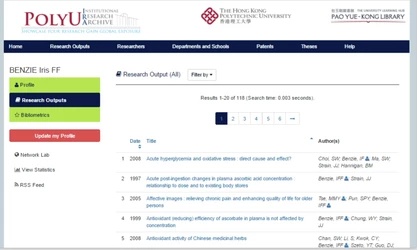
3) Statistics about each single entity
The statistics available at the general level, work for each single entity as well, allowing very detailed analysis.
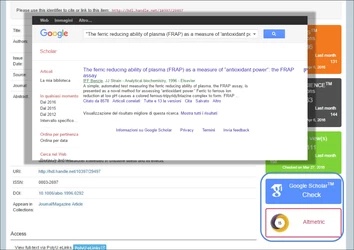
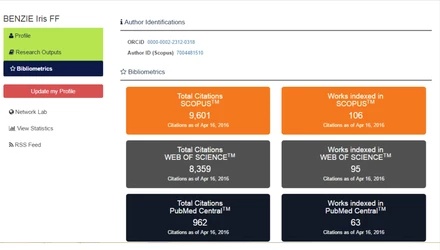
- Cited-by count in the item page
One example is the number of citations for each publication, coming from different external databases:
The systems has direct links to both Google Scholar and Altmetrics:
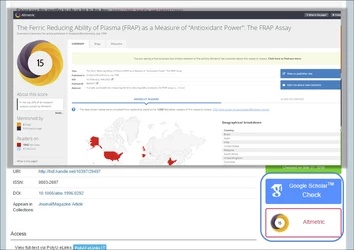
- Items’ views and downloads by regions
Or the views and downloads, based on types or regions or any other filter you need to apply:

4) Aggregated statistics of linked items
All the objects (publications, projects, etc.) linked to a researcher can be automatically included in her profile thanks to the DSpace-CRIS dynamic components:
And that works for the metrics too:
5) Automatic periodical alerts
Periodical alert can be configured to be automatically sent via email or RSS. For example when a publication is downloaded/viewed, or a new project starts, etc.