Fedora 4 Clustering Testing Summary
Virginia Tech finished the Assessment Plan - Clustering and report our works in this page. The detail step-to-step procedures was documented in Fedora Cluster Installation in AWS.
We applied read-only and read-dominant workloads to replicated Fedora 4 clusters. The write operation do not present as a bottleneck in our experiments. When the number of nodes increases, the maximum read load the cluster can handle also increases linearly. The read latency does not change significantly, although the write latency shows signs of increase when the number of replicated nodes increases. These results should give us high confidence on using replicated Fedora 4 cluster to accommodate higher read workload.
Testing object 1: Verify the load balanced cluster setup using the updated Modeshape and Infinispan configuration.
Outcome: The Fedora 4 cluster can setup successfully in Amazon AWS using the updated Modeshape and Infinispan configuration (Deploying in AWS). Detail procedure please see 2014-10-14 Acceptance Test - High Availability cluster.
Testing object 2: Demonstrate the nodes joining and node leaving in the cluster.
Outcome: Once a node is configured to replication mode, it is easily to add that node into the cluster. Through the AWS EC2 load balancer, it is easily to add/remove node from the cluster. The load balancer can distribute the traffic evenly. The detail procedure please see 2014-10-14 Acceptance Test - High Availability cluster.
Testing object 3: Measure the single and cluster's throughput and response time.
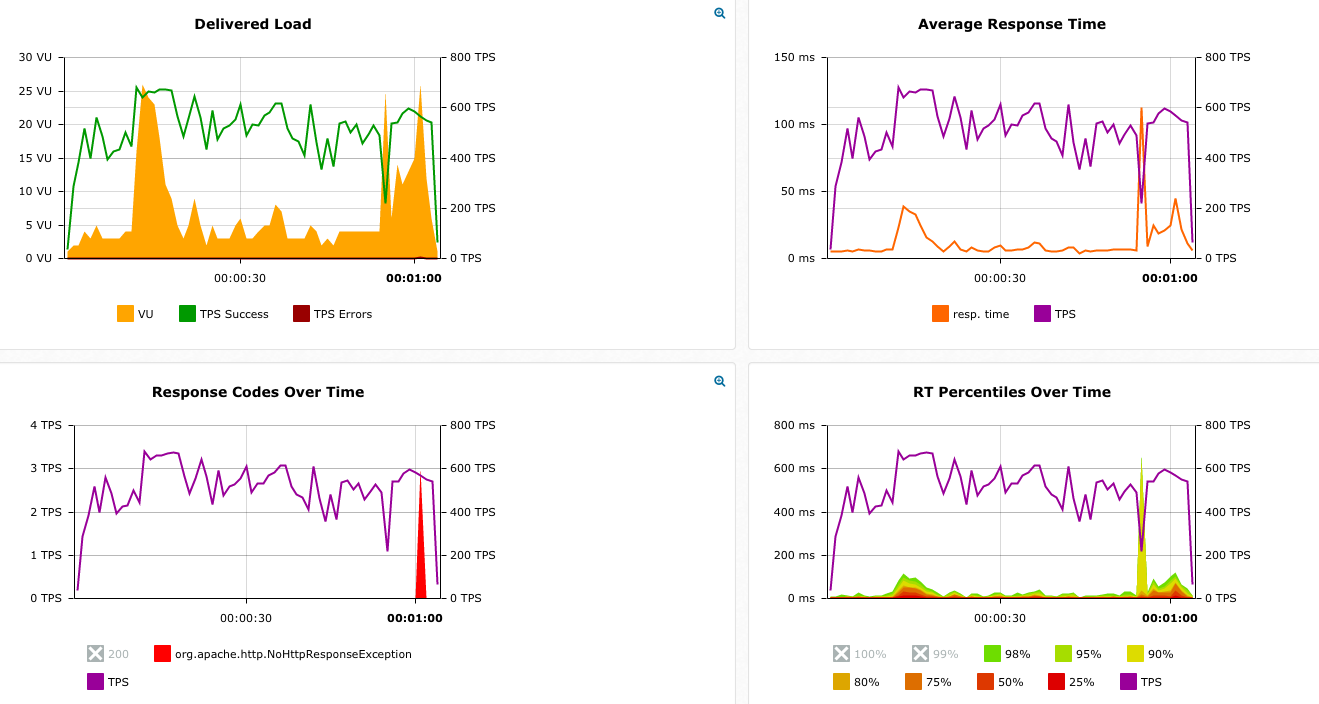
Outcome: We use JMeter to simulate 100 users requesting Fedora server at the same time for a period. When the request are under the server load, the read requests response time are the same in both single and cluster.
Test Setup | Num. Requests | Test Duration (Seconds) | Average Response Time (ms) |
|---|---|---|---|
| Individual | 1000 | 60 | 38 |
| Cluster (3) | 1000 | 60 | 38 |
| Cluster (4) | 1000 | 60 | 38 |
| Individual | 3000 | 60 | 21 |
| Cluster (3) | 3000 | 60 | 27 |
| Cluster (4) | 3000 | 60 | 26 |
| Individual | 6000 | 60 | 21 |
| Cluster (3) | 6000 | 60 | 24 |
| Cluster (4) | 6000 | 60 | 23 |
| Individual | 10000 | 60 | 21 |
| Cluster (3) | 10000 | 60 | 23 |
| Cluster (4) | 10000 | 60 | 21 |
Detail report: Response Time Comparison of Single Fedora VS Clusters
Testing object 4: Continue increasing the load until server is unable to handle further requests from the client.
Outcome: When the requests are approximately 525~550 requests per second, a single Fedora instance is start unable to accept further requests.
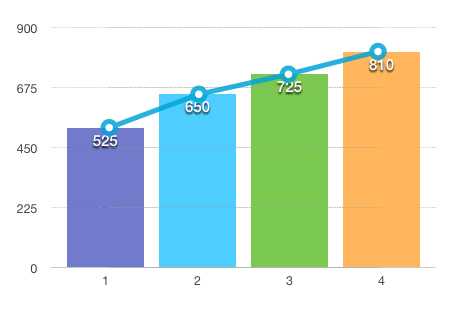
Testing object 5: Exam if the n-node (n >= 2) cluster handles n times as much requests as a single instance.
Outcome: We conducted load test on single, 2 nodes cluster, 3 nodes cluster, and 4 nodes cluster. Below table shows number of requests which server can response all requests completely.
| Single | Cluster (n=2) | Cluster (n=3) | Cluster (n=4) | |
|---|---|---|---|---|
| reqs/sec | 525 | 650 | 725 | 810 |
Testing object 6: n-JMeter (n=2) clients to send requests in different region/availability zone and measure the response time.
Outcome: There are 4 zone, which are US-East, US-West, Asia and EU. In each zone we run 2 JMeters and send requests to Fedora Cluster hosted in North Virginia. We average the response time for each zone and the response time summarized as below.
| US-EAST | US-WEST | ASIA | EU | |
|---|---|---|---|---|
| 100 reqs/sec | 5ms | 85ms | 284ms | 113ms |
| 300 reqs/sec | 5ms | 88ms | 278ms | 109ms |
| 600 reqs/sec | 5ms | 86ms | 273.5ms | 107ms |
| 1000 reqs/sec | 5ms | 90ms | 271.5ms | 112ms |
Testing object 7: Simulate real world case, 95% read requests and 5% write requests.
Outcome: To simulate real world case, we use a JMeter to send in a read/write(create/delete) ratio (95%/5%) per second and measure the average Fedora 4 cluster (3 nodes) response time.
| Read | Write | Action | Node | |
|---|---|---|---|---|
| Only Read reqs | 5ms | 4 | ||
| Only Write reqs | 13ms | Create | 4 | |
| Only Write reqs | 190ms | Delete | 4 | |
| Only Read reqs | 5ms | 3 | ||
| Only Write reqs | 21ms | Create | 3 | |
| Only Write reqs | 66ms | Delete | 3 | |
| Only Read reqs | 4ms | 1 | ||
| Only Write reqs | 13ms | Create | 1 | |
| Only Write reqs | 63ms | Delete | 1 |
| Read | Write | Action | Node | |
|---|---|---|---|---|
| R-reqs/W-reqs (95%/5%) | 4ms | 14ms | Create | 4 |
| R-reqs/W-reqs (95%/5%) | 5ms | 216ms | Delete | 4 |
| R-reqs/W-reqs (95%/5%) | 7ms | 29ms | Create | 3 |
| R-reqs/W-reqs (95%/5%) | 5ms | 61ms | Delete | 3 |
| R-reqs/W-reqs (95%/5%) | 4ms | 15ms | Create | 1 |
| R-reqs/W-reqs (95%/5%) | 4ms | 63ms | Delete | 1 |
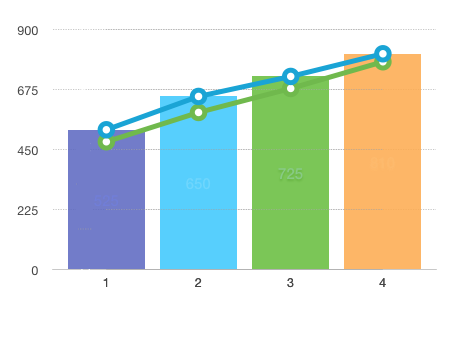
Below table shows number of requests which server can response all requests completely under pressure test. The read requests which server can handle reduced a little, however the write requests remains the same.
| Single | Cluster (n=2) | Cluster (n=3) | Cluster (n=4) | |
|---|---|---|---|---|
| RW-reqs/sec | 480 | 590 | 680 | 780 |
This figure shows the difference between read-only and read-write. Blue line shows read-only and green line shows read-write.
1 Comment
Andrew Woods
Yinlin Chen, could you provide definitions of the x and y-axis units for the graphs in section: "testing object 4"?
For example: