Statistics
- Student: Federico Paparoni
- Mentor: Richard Jones
- Mentor Backup: Stuart Lewis
Architecture
The possible architecture for this application is shown in the next diagram
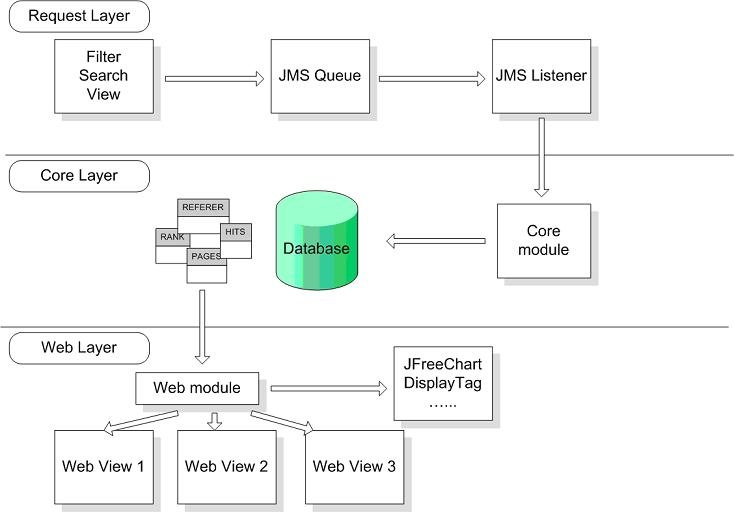
In the next paragraphs there will be discussed all the layers functioning
Request Layer
Informations can be collected by different sources. The informations that this application want to show from the Web interface can be described in the next list:
• Number of hits per page
• Number of hits per Community
• Number of hits per Collection
• Number of hits per Item
• Searches on DSpace platform
• Referer list with URL
• Search Engine referer
• Country/State of visitors
To provide these informations, there is a simple API, that can be used everywhere in the DSpace platform. The basic object for this API is LogEvent, a class that maps the standard informations for an event system
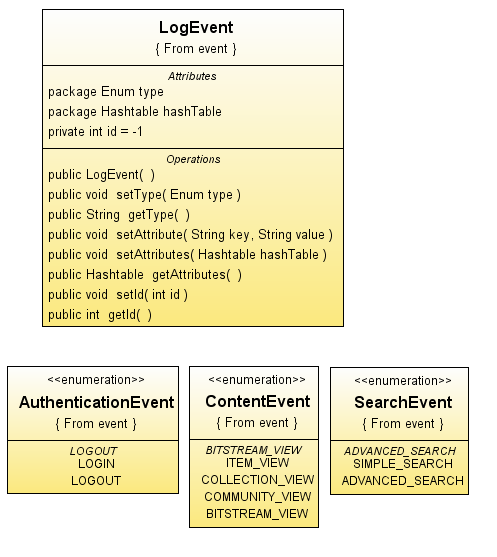
Every event in the platform can be described using this class. The Enum "type" contains the typology of event, the Hashtable "hashTable" contains couples param-value. In the Statistics Application there are some Enums for events already defined, AuthenticanEvent, ContentEvent and SearchEvent, but it's possible to enhance the events with the definition of another Enum. In the Enums already defined there are some basic events that are used by Statistics application to create statistics data.
Post a new Statistic event in the DSpace platform is a simple task. In the next code you can see how it works
_LogEvent logEvent = new LogEvent();
logEvent.setType(ContentEvent.BITSTREAM_VIEW);
logEvent.setAttribute("id", ""+bitstream.getID());
logEvent.setAttribute("ip", request.getRemoteAddr());
logEvent.setAttribute("referer", request.getHeader("referer"));
logEvent.setAttribute("language", request.getLocale().getLanguage());
StatsLogger.logEvent(logEvent); _
The main points involved in the logging-process are the components that represent and manage the items/collections/communities. The Statistics application is based on the standard DSpace Web UI, so it uses the Servlets that load data to collect statistics informations. Of course the architecture can change (with [ Manakin|http://wiki.dspace.org/Manakin] for example). In that case there will be the need to identify the points of logging in the new architecture.
JMS event system
In DSpace there is already something like the system I have proposed (http://wiki.dspace.org/index.php/EventSystemPrototype). Anyway for the development of this application it isn't mandatory to use this implementation, but some ideas are the same.
A JMS event system for the statistics applications can be useful for different reason:
• There isn't the need of a process that grabs informations from a log file and put it on the database. This means also live stats (or delayed if the implementation will use a buffer of LogEvent). Anyway the standard log file will be maintained.
• Loose coupling between the part of application that logs statistic informations, the database and the views (if there is new informations to be logged i haven't the need to use a particular logfile or a particular configuration of log4j, i have only to attach the JMS queue and send a LogEvent object)
• Possible distribution of the software (i can install DSpace and stats application on different machines)
• Possible unification of the statistics among different DSpace istances (http://indico.cern.ch/getFile.py/access?contribId=8&sessionId=14&resId=0&materialId=slides&confId=5710)
The possible negative reasons are:
• Memory leak: A normal throughput of the stat events can be easily managed from the JMS queue without memory leak
• Too many JDBC connection: Only one JDBC connection will be used by the JMS Listener object
• 3rd party library and jars: the choose of JMS implementation will consider the number of jars and libraries that have to be included
• Old stats application: the use of old stats application or the new one will be configuration based (a flag for the choose in the dspace configuration file)
Logging mechanism
The logging mechanism is based on a JMS event queue. The JMS implementation used by Statistics Application is Apache ActiveMQ.
From each point of DSpace architecture it is possible to enter an event entry, using a simple insert on the JMS queue. The setup of the JMS event queue and the JMS dispatcher is a task of org.dspace.statistics.StartupStatsServlet, a startup Servlet that loads some informations about the JMS queue from the file META-INF/context.xml (shown below) and creates an istance of org.dspace.statistics.JMSDispatcher, a class that implements javax.jms.MessageListener interface. The META-INF/context.xml file contains the informations needed by StartupStatsServlet to setup the environment
_<?xml version="1.0" encoding="UTF-8"?>
<Context>
<Resource
name="jms/ConnectionFactory"
auth="Container"
type="org.apache.activemq.ActiveMQConnectionFactory"
description="JMS Connection Factory"
factory="org.apache.activemq.jndi.JNDIReferenceFactory"
brokerURL="tcp://localhost:61616"
brokerName="LocalActiveMQBroker"
useEmbeddedBroker="false"/>
_
_ <Resource name="jms/queue/MyQueue"
auth="Container"
type="org.apache.activemq.command.ActiveMQQueue"
factory="org.apache.activemq.jndi.JNDIReferenceFactory"
physicalName="EventQueue"/>
</Context>_
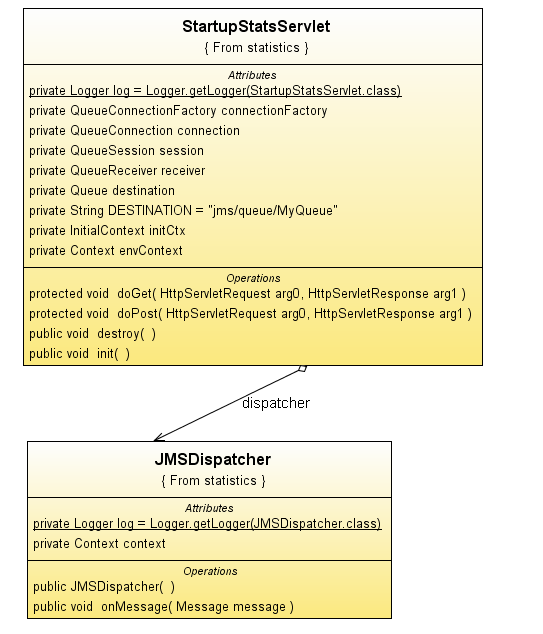
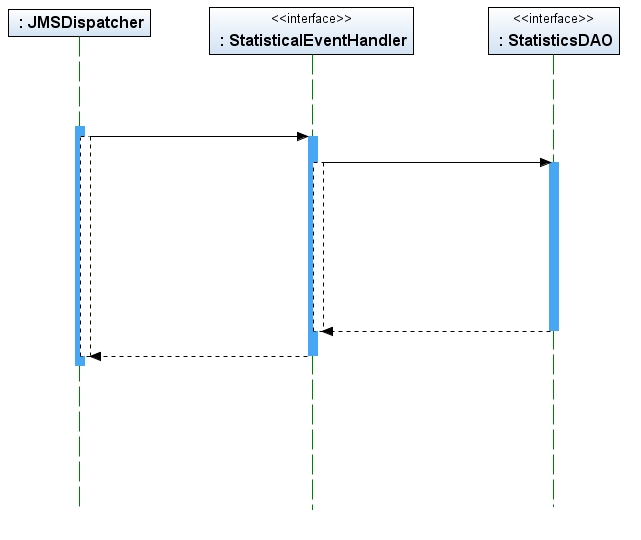
The receiver of all JMS event queue objects, JMSDispatcher, has a method onMessage() defined by javax.jms.MessageListener that is called once for every object arrived in the queue. JMSDispatcher has to choose the right behaviour for every LogEvent and this choice is done using the DSpace Plugin Manager.
Every type of LogEvent defined in the Statistics application have a handler class that can manage it. The interface for these handler class is org.dspace.statistics.handler.StatisticalEventHandler. Using the DSpace Plugin Manager, JMSDispatcher choose the right class for every LogEvent.
_logEvent=(LogEvent)objectMessage.getObject();
log.info("LogEvent "+logEvent.getType());
StatisticalEventHandler handler =(StatisticalEventHandler)PluginManager.getNamedPlugin(StatisticalEventHandler.class,logEvent.getType());
handler.setContext(context);
handler.setLogEvent(logEvent);
handler.process();_
There is the need of some configuration to use DSpace Plugin Manager, as you can see in the next lines
_plugin.named.org.dspace.statistics.handler.StatisticalEventHandler = \
org.dspace.statistics.handler.SearchEventHandler = SIMPLE_SEARCH,ADVANCED_SEARCH, \
org.dspace.statistics.handler.AuthenticationEventHandler = LOGIN, LOGOUT, \
org.dspace.statistics.handler.ContentEventHandler = ITEM_VIEW, COLLECTION_VIEW, COMMUNITY_VIEW, BITSTREAM_VIEW \
_
Basic statistic events
There are a lot of events that can be useful for statistics on DSpace. Using this architecture the definition of a new event and the use of this event is a simple task. For this reason now it will be defined a small set of simple events, that can be surely enhanced. In the next list you can find the events and the related point in DSpace code where these events will be "logged":
• Item Views
• Collection Views
• Community Views
Source: org.dspace.app.webui.servlet.HandleServlet
• File Views
Source: org.dspace.app.webui.servlet.BitstreamServlet
• number of logins (and who)
Source: org.dspace.eperson.AuthenticationManager
• most popular searches
Source :org.dspace.app.webui.servlet.SimpleSearchServlet
Source: org.dspace.app.webui.servlet.ControlledVocabularySearchServlet
This list is based on the 1.4.2 version of DSpace and [ Manakin|http://wiki.dspace.org/Manakin] or other UI aren't considered. This statistics application can be easily used also in different version of DSpace, simply choosing classes/points that have to post log events.
Core layer
This layer is the point where the informations queued in the JMS queue will be written in the database. Every type of LogEvent have a different DAO class that manages it.
This modular approach has been made to enable other developers to customize this application and create different handler, for different type of LogEvent and also different DAO class that can be used to store the informations on the database.
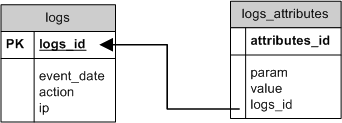
Database schema
The LogEvent class and the whole parametric approach suggested a schema with two table, logs and _logs_attributes. _The first table contains every LogEvent, with the next informations:
- logs_id: ID of LogEvent, created by a sequence
- event_date: Timestamp of the event
- action: Type of action
- ip: IP of user
Every LogEvent has some attributes, contained in a Hashtable object. These informations are mapped into the logs_attributes table, where there is
- attributes_id: ID of attribute, created by a sequence
- param: Name of param
- value: Value of param
- logs_id: ID of LogEvent
Crawlers and Search Engine
Into the package org.dspace.statistics.tools there are two classes that are used to establish when a visitor is a Crawler and when a visitor arrived from a Search Engine.
These two classes are
• org.dspace.statistics.tools.CrawlerCheck
• org.dspace.statistics.tools.SearchEngineParser
CrawlerCheck uses a simple list of ip, contained in a file described into the dspace configuration file
crawlers.list = ${dspace.dir}/config/crawlers.list
If CrawlerCheck understand that a visitor is a crawler, the ContentEvent related (ITEM_VIEW, COMMUNITY_VIEW, COLLECTION_VIEW or BITSTREAM_VIEW) is discarded.
SearchEngineParser checks the HTTP referer value of a ContentEvent and if a search engine applies to this referer, it adds a couple of param-value to notify the Search Engine referer.
These are two simple example of it's possible to enhance every LogEvent
Web layer
The Web Layer will create different views, containing the informations collected.
There is two different kind of report that has been developed ofr Statistics Application: the List-Report and the Graph-Report
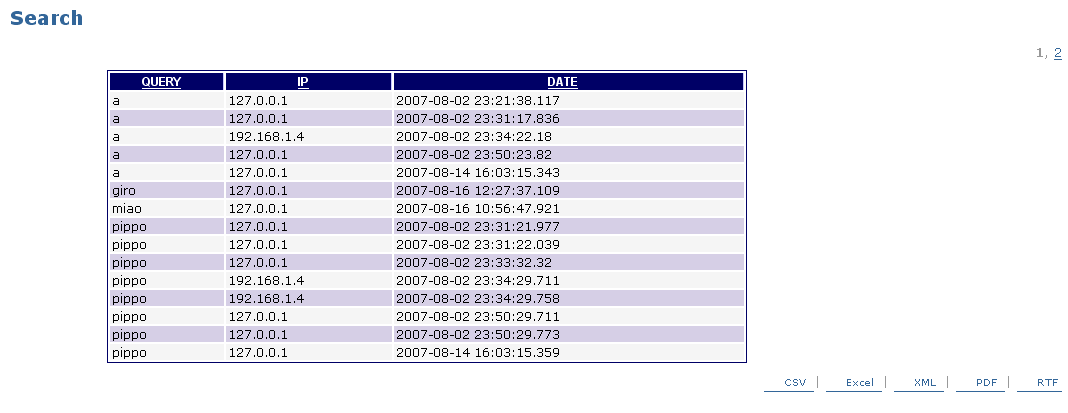
The List-Report is a report that display some LogEvents using the Display Tag Library. There is a Servlet (org.dspace.statistics.web.ListLoader) that, using the DAO class retrieves the informations from DB and create the objects needed by Display Tag Library to create the report.
All the List-Reports are configured in the dspace configuration file using a simple format as shown below
list.views = list_search,list_today_search,list_view
_list_search.name = Search
list_search.action = SIMPLE_SEARCH
list_search.date = true
list_search.attributes = query,ip
list_search.range = -1
list_search.items = 15
list_search.filter = 0
list_today_search.name = Today Search
list_today_search.action = SIMPLE_SEARCH
list_today_search.date = true
list_today_search.attributes = query,ip
list_today_search.range = 0
list_today_search.items = 30
list_today_search.filter = 0
list_view.name = Item View
list_view.action = ITEM_VIEW
list_view.date = true
list_view.attributes = id,referer,ip,language
list_view.range = -1
list_view.items = 15
list_view.filter = id,org.dspace.statistics.tools.ItemFilter,Item Name|ip,org.dspace.statistics.tools.IpFilter,Country_
For every List-Report item there are some parameters, that modifies the List-Report
- name : Name shown in the browser
- action: LogEvent action
- date: This boolean property establishes if we want the event_date information in the report
- attributes: Attributes related to the LogEvent that must be retrieved and displayed
- range: -1 means all the events, 0 means today, 1 means yesterday and so on
- items: Number of items displayed for every page
- filter: 0 means there isn't the need of a filter, otherwise there is the description of a filter usage (described below)
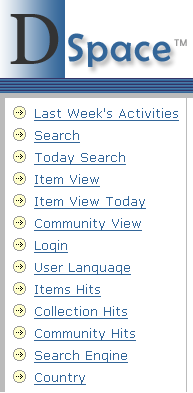
It's possible to define different List-Report and then the Statistics Application will load all items configured into the menu (using a new JSP page layout/navbar-statistics.jsp)
The filter parameter is useful when there is the need to translate something stored by the LogEvent in a different way. For this reason there is an interface, org.dspace.statistics.tools.ObjectFilter, that defines the method to create a new filter. In the Statistics Application there are 4 filters
- org.dspace.statistics.tools.ItemFilter: Used to translate id to the title of Item
- org.dspace.statistics.tools.CommunityFilter: Used to translate id to the title of Community
- org.dspace.statistics.tools.CollectionFilter: Used to translate id to the title of Collection
- org.dspace.statistics.tools.IpFilter: Used to translate ip to the country of visitor (uses MaxMind - GeoIP library)
Other filter for other attributes can be easily added to the Statistics Application using this modular approach
The other kind of report that has been realized for Statistics Application is Graph-Report. These reports use Display Tag Library and JFreeChart.
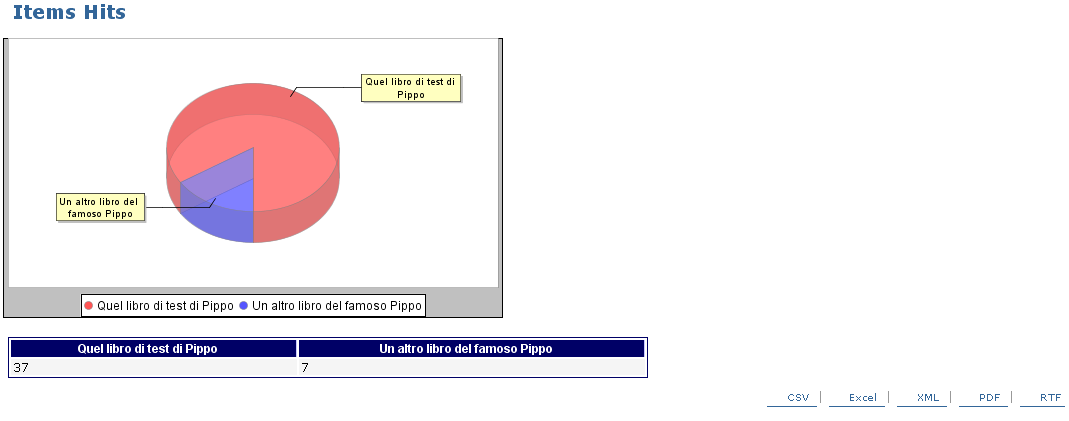
The Servlet org.dspace.statistics.web.GraphLoader retrieves the informations using the DAO class (as in the List-Report).
Also for these reports there is a simple configuration based on dspace.cfg that enables the creation of a customized menu
graph.views = user_language, items, search_engine, country
_user_language.name = User Language
user_language.type = Content
user_language.action = ALL
user_language.attribute = language
user_language.filter = 0
items.name = Items Hits
items.type = Content
items.action = ITEM_VIEW
items.attribute = id
items.filter = org.dspace.statistics.tools.ItemFilter_
_country.name = Country
country.type = Content
country.action = ALL
country.attribute = ip
country.filter = org.dspace.statistics.tools.IpFilter_
Also here there are some parameters that must be inserted
- name : Name shown in the browser
- type: Type of event (Content, Authentication, Search)
- action: LogEvent action (it is possible also to set ALL, to sum every event of a category)
- attribute: The only attribute related to the LogEvent that must be retrieved and rendered
- filter: 0 means there isn't the need of a filter, otherwise there is the class of a filter (same filter used before but in that case there is a different method called)
Setup
1) Download modified version of DSpace, with Statistics Application from
http://dspace-gsoc.googlecode.com/svn/dspace-branches/2007/statistics-1_4_x/dspace/
In the released dspace.cfg there already configured some reports (List and Graph)
There are others configuration file modified for Statistics Application, like
[etc/dspace-web.xml] (with the definition of new Servlets and mappings)
[jsp/META-INF/context.xml] (with the definition of JMS resources)
2) Download and install the following dependencies:
•DisplayTag Library 1.1 (include displaytag-1.1.jar and displaytag-export-poi.jar)
•Apache Commons BeanUtils 1.7.0
•Apache Commons Collections 3.1 (RJ: already contained in standard DSpace distribution)
•Apache Commons Lang 2.1 (RJ: already contained in standard DSpace distribution)
•MaxMind - GeoIP Java API 1.2.1 (RJ: you have to compile this yourself)
•Apache ActiveMQ 4.1.1 (also needed for the JMS queue)
3) Create the database tables. you can use the script released under sql-db.sql
4) Run the ActiveMQ broker using $HOME_ACTIVEMQ/bin/activemq.sh for Linux/Unix or $HOME_ACTIVEMQ/bin/activemq.bat for Windows
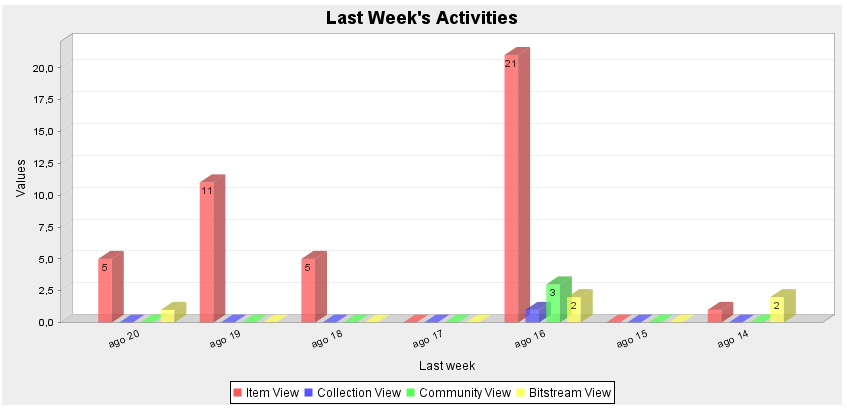
5) Login into the DSpace Administrator Menu and if everything works you can see the Last Week's Activities
Clean database
There is a tool class, org.dspace.statistics.tool.CleanDatabase, that can used to clean the tables logs and logs_attributes.
This class can be executed using the next command
For Linux/Unix
bin/dsrun org.dspace.statistics.tool.CleanDatabase A_NUMBER
For Windows
bin/dsrun.bat org.dspace.statistics.tool.CleanDatabase A_NUMBER
The number used as parameter is the day from which will be deleted the logs.
0 means from today
1 means from yesterday
and so on
Now these logs are deleted, but in the future will be developed something to create a report sent by mail and also some tables to aggregate these informations (useful for statistics purposes).
External Resources
- Google Driving Directions
- Krugerrand Coins
- Mapquest Driving Directions
- Make Money Online
- Ganar Dinero Online
- Peliculas Online Gratis
- Traductor Google
- Google Earth
- Financial Planning
- 0 Credit Cards
- Debt Consolidation Loans
- Money tips
- Make Money
- Gana Dinero
- Descargar Messenger Gratis
- Round Kitchen Table
- fast money
- make a website