This section will show you how to access some of the basic error reporting functions for Drupal, Fedora, Apache, Tomcat, and Microservices. For specific troubleshooting on the installation process, check out Troubleshooting Installation.
Most components in the Islandora stack have their own log. This document will describe each of those logs: where they can be found; how to configure them; and what information they contain. Logs typically have "levels" which are used to determine what kinds and how much information should be placed in them. A general rule of thumb is that a log will support the following levels in order of the most information to the least:
When you encounter a problem or are doing development you should check that the log is configured to store as much information as possible.
Error Reporting in Drupal
Drupal core/modules often display Drupal, PHP, and SQL error messages to the end user in the browser as they happen. Often these messages will refer to a problem/action that occurred during the previous request. Most likely if you encounter a problem at this level, someone else has as well; its best to search google for relevant information. The issues are colour coded by seriousness, (red = error, yellow = warning, green = status/info).
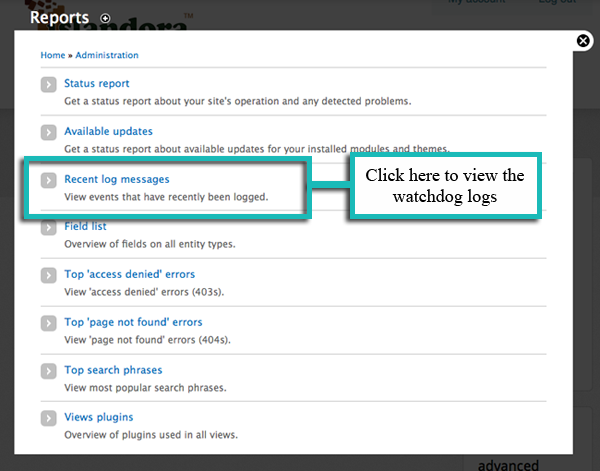
Drupal also logs information to what it calls the 'watchdog'. The watchdog is essentially a database table, within the Drupal database. It contains messages generated by Drupal core/module code. You can view the 'watchdog' by visiting "http://yoursite/admin/reports/dblog" or by logging into your site, clicking the 'Reports' link in the admin bar (or navigating to http://URL.of.your.site/admin) and clicking 'Recent log entries' under 'Reports'. Errors are categorized by "type" which usually indicates which module generated the message.
You will see a list of recent log entries from various sources. Not all entries are errors - error messages will be marked with a red 'X'.
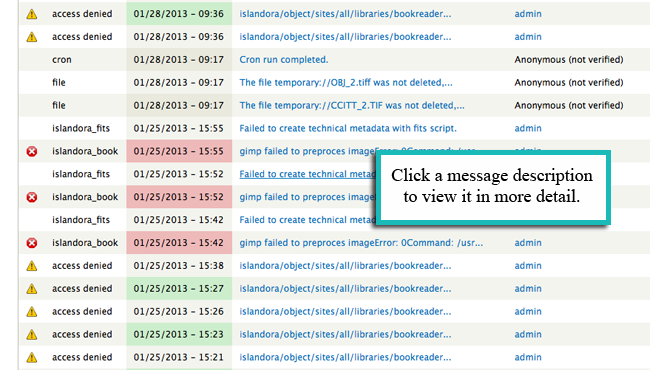
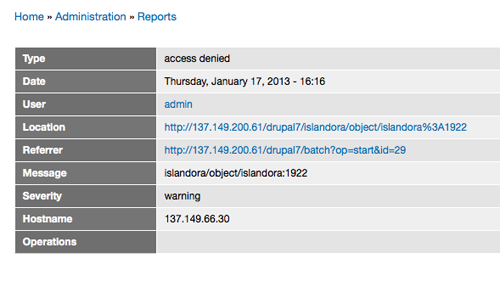
Clicking on a message description will give you a detailed summary of the error. You can use this information to troubleshoot a problem yourself, or to provide more detail to a technical support contact.
Check the watchdog frequently even when the site is working correctly. Many non-fatal issues will be logged to the watchdog. Be proactive! Check the watchdog when:
- An error message is displayed on the webpage.
- The page appeared to work but something is missing or an action didn't take place.
Sometimes when working on a problem its useful to export the logs into a shareable format so that others in the community can help troubleshoot the problem. There are several ways to do this. If you have Drush installed you can dump the table like so:
drush sql-dump --tables-list="watchdog" > watchdog.sql
Or you render the logs to a file:
drush ws --count=1000 >watchdog.log
For more options to ws, use “drush help ws”. Since using “drush ws” doesn’t provide all the information in the watchdog its recommended that you use “drush sql-dump” for sharing.
You can import a dump watchdog log like so:
drush sql-query "TRUNCATE watchdog;"; drush sql-cli < watchdog.sql
This will remove your local watchdog so be careful!
Error Reporting in Fedora
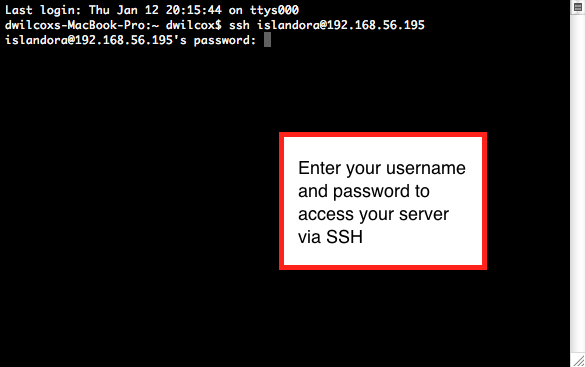
Fedora error reporting can be access via the command line (assuming you have the right permissions). Start by opening a Terminal window and type the following:
ssh username@ip.address.of.server
You will then be prompted for your password.
Navigate to your Fedora logs directory; for example:
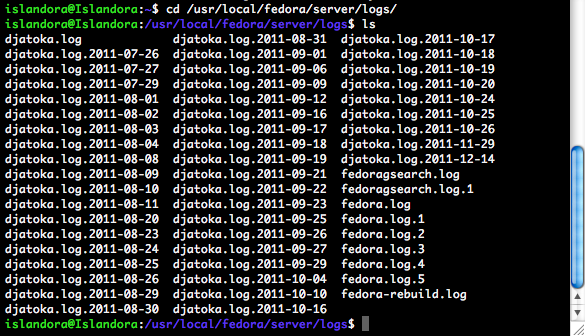
cd /usr/local/fedora/server/logs
From here you can type 'ls' to view a list of files in the directory.
You can view a log file in various ways; for example:
This will print the log to the screen. You can use this information to troubleshoot a problem yourself (depending on your level of Fedora knowledge), or to provide more detail to a technical support contact.
There are several log files kept by Fedora they are kept in several different directories. Information generated from the "$FEDORA_HOME/client/bin" scripts is logged to "$FEDORA_HOME/client/logs"; typically you won't need to review these logs. The bulk of interesting information is stored in "$FEDORA_HOME/server/logs". Here you will find fedora.log, fesl.log, and sometimes fedoragsearch.log, and djatoka.log depending on how GSearch and Adore-Djatoka are configured.
You can configure the various logs in Fedora by modifying "$FEDORA_HOME/server/config/logback.xml". Typically there are two log files fedora.log, and fesl.log configured for the loggers "fcrepo", "jaas", "xacml". You can set the log levels for any of the defined loggers by changing the @level attribute to either (DEBUG, INFO, WARN, ERROR, FATAL). You can create separate log files for any of the defined loggers by defining a new appender, and setting the logger's appender-ref @ref attribute.
Fedora uses SLF4J with Logback in more recent versions, prior to version 3.4 Fedora used Log4J, which is still used in GSearch. For a full list of configuration options refer to each of those projects documentation.
fedoragsearch.log can be configured before building with ant, or via the configuration file "$CATALINA_HOME/webapps/fedoragsearch/WEB-INF/classes/log4j.xml" can be modified after GSearch has been configured.
Set the output of fedoragsearch for versions of gsearch prior to 2.3:
<appender name="FILEOUT" class="org.apache.log4j.FileAppender">

<param name="File" value="/usr/local/fedora/server/logs/fedoragsearch.log">

...

</appender>
Set the output of fedoragsearch for versions of gsearch 2.3 or later:
<appender name="FILEOUT" class="org.apache.log4j.DailyRollingFileAppender">

<param name="File" value="/usr/local/fedora/server/logs/fedoragsearch.daily.log"/>

...

</appender>
Set the level of output (DEBUG, INFO, WARN, ERROR, FATAL) for versions of gsearch prior to 2.3 append LEVELG to the selected level, for search 2.3 and later only use the level:
<logger name="dk.defxws.fedoragsearch" additivity="false">

<level value="DEBUGLEVELG" />

<appender-ref ref="FILEOUT"/>

</logger>
Include SOLR logs in the fedoragsearch.log. Set the level of output (DEBUG, INFO, WARN, ERROR, FATAL) for versions of gsearch prior to 2.3 append LEVELS:
<logger name="dk.defxws.fgssolr" additivity="false">
<level value="DEBUGLEVELS" />
<appender-ref ref="FILEOUT"/>
</logger>
You can define more than one appender to separate out the various logs in log4j.xml. Or you can modify the tomcat logs as is demonstrated below.
djatoka.log can be configured in “$CATALINA_HOME/webapps/adore-djatoka/WEB-INF/classes/log4j.properties”. While djatoka still uses log4j, it has a properties file rather than an xml file, so configuring it is slightly different.
Here is an example “log4j.properties” the directory and level information is bolded:
# REPORTING LEVELS: OFF, DEBUG, INFO, WARN, ERROR and FATAL
log.dir=/usr/local/fedora/server/logs/
datestamp=yyyy-MM-dd/HH:mm:ss.SSS/zzz
roll.pattern.hourly=.yyyy-MM-dd.HH
roll.pattern.daily=.yyyy-MM-dd
#djatoka.log -- Default catch-all.
log4j.rootLogger=DEBUG, defaultLog
log4j.appender.defaultLog=org.apache.log4j.DailyRollingFileAppender
log4j.appender.defaultLog.DatePattern=${roll.pattern.daily}
log4j.appender.defaultLog.File=${log.dir}/djatoka.log
log4j.appender.defaultLog.layout=org.apache.log4j.PatternLayout
log4j.appender.defaultLog.layout.ConversionPattern=%d{${datestamp}} [%t] %-5p %m%n
Apache Logs
The location of the apache error log and what other logs (access, etc) are available will depend on your operating system, apache version, and apache settings. The error log will contain any problems that occurred while processing a request. Errors generated by PHP code that are not caught by Drupal will usually be logged here. The access log will typically contain requests made to apache and if apache denied them access.
Here are some typical locations for the log files:
Ubuntu/Apache 2:
- Error Log: /var/log/apache2/error.log
- Access Log: /var/log/apache2/access.log
CentOS/Apache 2:
- Error Log: /var/log/httpd/error_log
- Access Log: /var/log/httpd/access_log
Check these logs when:
- The page white screens, check the Apache error log first, it most likely will be a PHP syntax error.
- The watchdog didn't provide any useful information.
To customize the output of the apache logs (Set the log level, etc) follow the instructions provided here: (http://httpd.apache.org/docs/1.3/logs.html) Any changes to the configuration of Apache require that Apache be restarted.
Ubuntu:
CentOS:
The Apache Tomcat logs may also be useful in diagnosing problems. You can access these logs by navigating to your Tomcat logs directory; for example:
cd $FEDORA_HOME/tomcat/logs
The most relevant log file in this directory is catalina.out. As with fedora.log, you can view this file in various ways; for example:
Tomcat Logs
Tomcat logs are typically found in "$CATALINA_HOME/logs". Tomcat logs can be configured in "$CATALINA_HOME/conf/logging.properties", for in-depth information on configuring the logging done by Tomcat, and various webapps consult (http://tomcat.apache.org/tomcat-6.0-doc/logging.html).
Separate SOLR logs into a different file then fedoragsearch.log. Modify the handlers and add the information for the SOLR file handler:
handlers = 1catalina.org.apache.juli.FileHandler, 2localhost.org.apache.juli.FileHandler,
3manager.org.apache.juli.FileHandler, 4host-manager.org.apache.juli.FileHandler,
5localhost.org.apache.juli.FileHandler, java.util.logging.ConsoleHandler
...
5localhost.org.apache.juli.FileHandler.level = WARNING
5localhost.org.apache.juli.FileHandler.directory = ${catalina.base}/logs
5localhost.org.apache.juli.FileHandler.prefix = solr.
...
org.apache.solr.level=INFO
org.apache.solr.handlers=5localhost.org.apache.juli.FileHandler
Microservices
Logging can be configured by modifying islandora_listener.cfg in the Micro-services home directory typically "/opt/islandora_microservices/islandora_listener.cfg".
The level and output file and size of log can be set like so:
[Logging]

file: islandora_listener.log

;Supported levels are DEBUG, INFO, WARNING, ERROR, CRITICAL

level: DEBUG

; The maximum log size in bytes before a log rotation

; a setting of zero means never rotate

max_size: 10485760

; number of backup logs to keep

backup: 5