Co-Authorship and Co-Investigator Network Visualizations
Prior to 1.8.1, co-authorship and co-investigator graphs were provided by a Flash based component, preventing anyone that doesn't have Flash installed - in particular, mobile devices - from viewing them.
In 1.8.1, a new way of rendering these visualizations has been included, and they ARE enabled by default when you upgrade an instance - you need to update the runtime.properties - see the section at the bottom of this page for details.
Based on a Javascript library that generates svg markup (D3), it will render in any current browser - from IE9 onwards.
The visualization that has been implemented is also more colourful, and displays larger, as can be seen in the following examples:
Co-Investigator Network in Chrome/OS X

It doesn't have exactly the same features as the Flash version. But if you hover over a label, or the colored bar immediately next to it, then the chords the represent the relationships of that person will be highlighted, and a popup will be displayed with additional information.
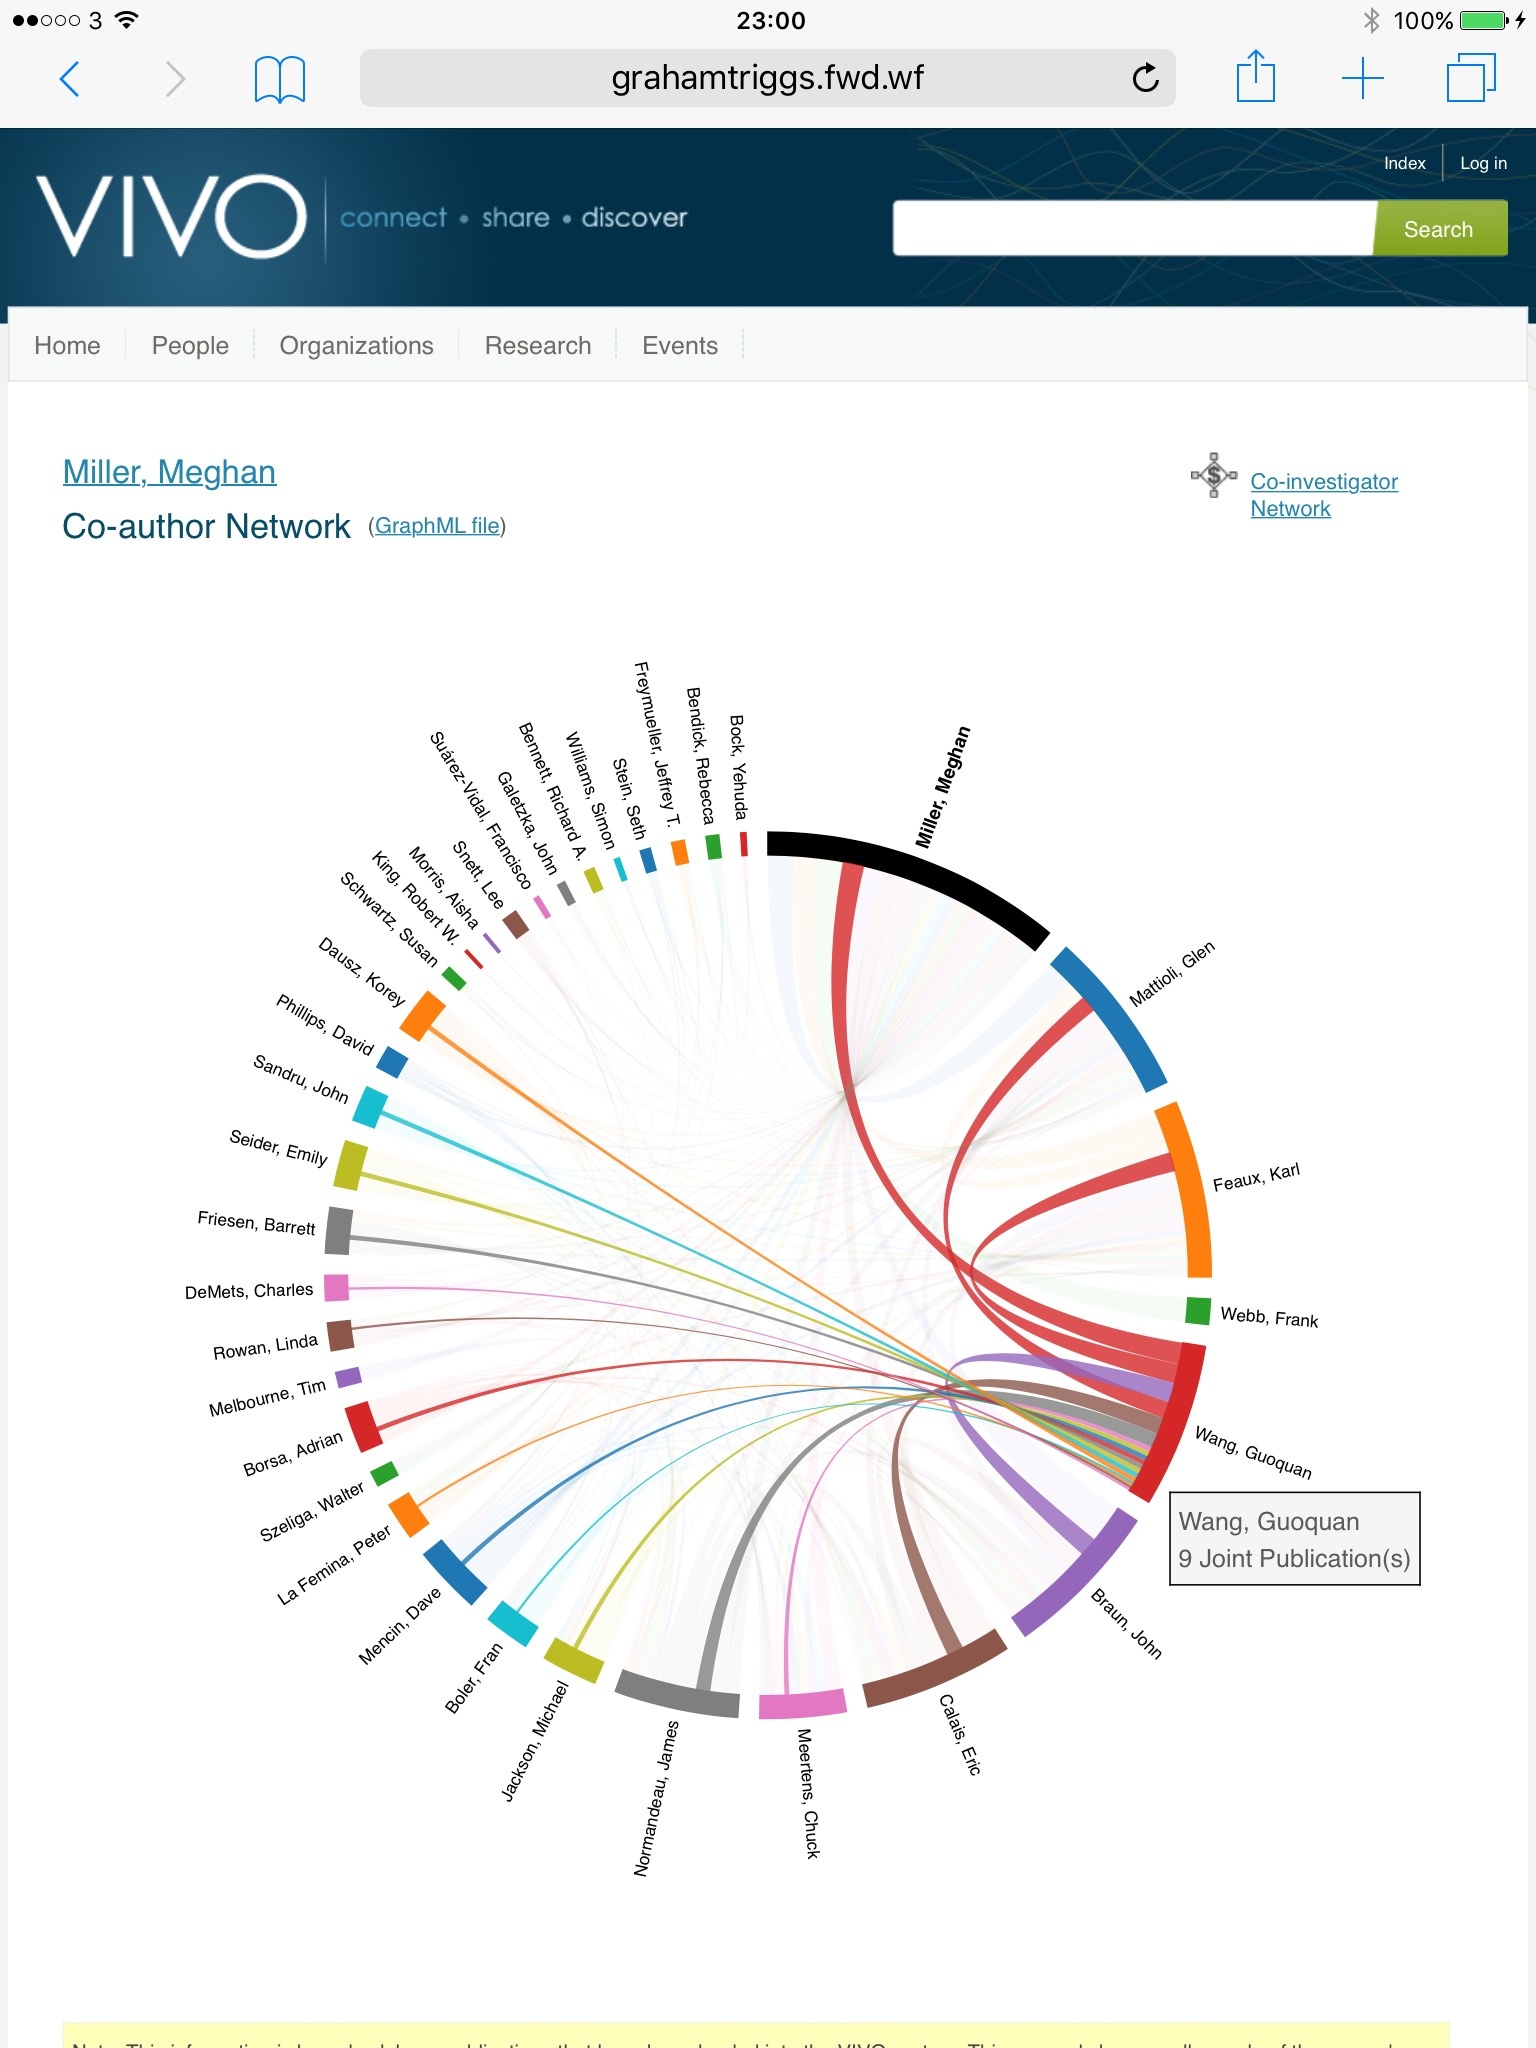
And, as suggested above, it works on mobile devices. For example, here is it working on an iPad - the highlighting of a set of relationships and an information popup is also included:
Returning to the Flash Visualizations
Whilst faster and compatible with a wider range of browsers, the new visualizations may not be suitable if you need to support users with IE 8. If you wish to use the traditional Flash visualisations, you will need to add the following to your runtime.properties.
visualization.d3 = disabled
(Note that it is not currently possible to offer different visualizations based on the client - you will have to choose to have VIVO use either one style or the other)