...
Research Graph is an integrated network of information about researchers, their publications, grants, and datasets, across global research infrastructures such as ORCID, DataCite, CERN, CrossRef, and funders such as National Institutes of Health (NIH). The At the time of writing this article, the Research Graph network currently connects more than 20 thirty million research object objects across Australia, Europe, United States and Japan.
For example, when provided “seed data,” such as a simple list of researchers, Research Graph will identify publications, grants, and/or datasets related to those researchers and represent the information in a graph. These are referred to as “first order” connections. Research Graph is also capable of identifying and linking collaborators of the people in the “first order” data and linking their publications, grants and datasets. These collaborator links are referred to as “second order” connections. We are not aware of any other technology or product, open source or proprietary, that can offer “second order” connections.
...
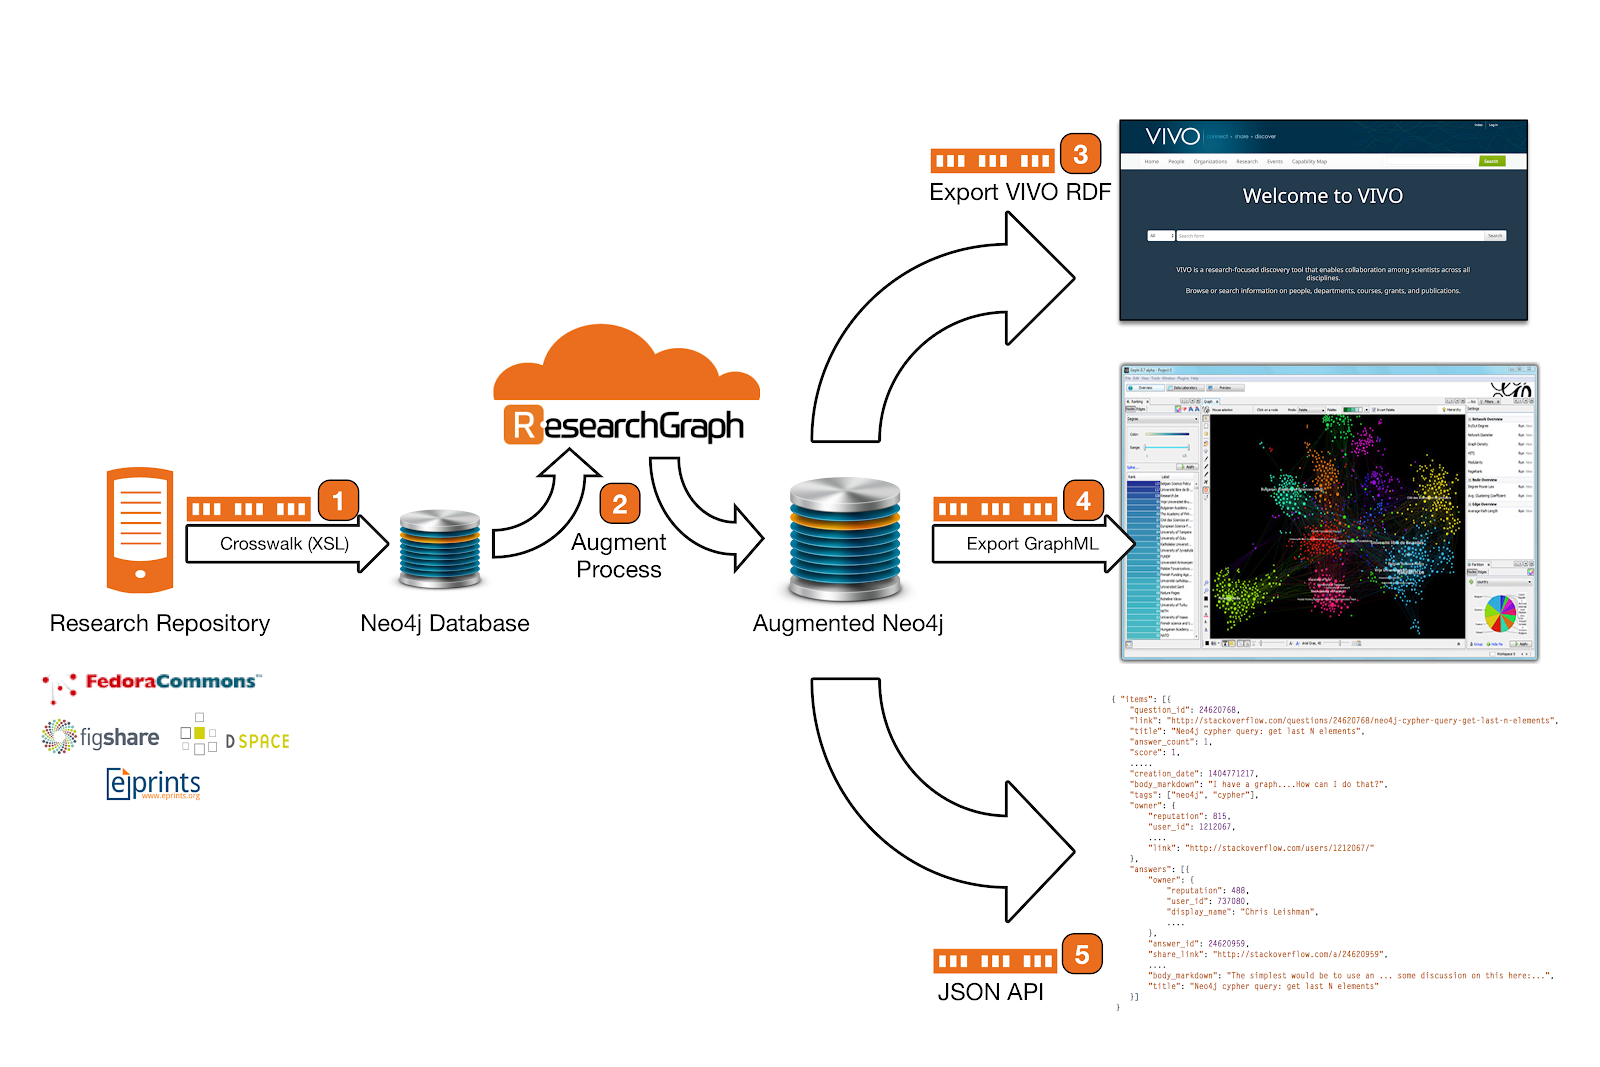
This process has been accomplished by using Research Graph. The outcome has the potential to resolve common difficulties experienced while finding, disambiguating, transforming, and mapping data for ingest into VIVO. Figure one shows the outcome of the augmentation process for the data from the National Computational Infrastructure in Australia As illustrated in the following figure, during this pilot we enrich the research repositories’ data by (1) Transforming repository data to a graph database, (2) Augmenting the graph with the Research Graph data, (3) Making this graph available as a VIVO instance. In addition, we make the graph data available as GraphML or JSON for further analysis and visualisation.
There are three types of organisations that can benefit from the collaboration between VIVO and Research Graph.
...
The organizations that expressed interest in the Research Graph VIVO Cloud Pilot have varying levels of knowledge of the projects and technologies. Two of the organizations are extremely knowledgeable and involved in the VIVO and Research Graph communities. They are located in Australia and Germany. The
...
This first phase will enable the Cloud Pilot Team to confirm what they consider to be the most important and unknown technical variable of the project, e.g. how large the seed data will grow after first and second level connections are made and what impact that will have on hosted server resources, cost, and performance.
The Cloud Pilot will also provide excellent information on scaling the service. Using subsets of Pilot Organization data, we can identify small to medium graph sizes. Using their entire faculty as seed data, we can load and scale test to large sizes. The organizations identified for the first phase of the Cloud Pilot are thought leaders in linked data, repositories, and the open science community. Their involvement lowers project risks and helps build understanding of a potential international service offering.
Pilot Deliverables
A successful, multi-phased Cloud Pilot will produce information suitable for a go-no go decision regarding the creation of a joint Research Graph VIVO Cloud Service, including:
...
A formal service definition
...
Market analysis, including what we consider acceptable annual pricing. Anecdotally, we see evidence of demand for such a service, particularly among US and European research institutes with smaller staffs, and universities and institutes interested in VIVO concepts, but unwilling to master VIVO technologies (ontologies, triple stores, and linked data), and sites seeking outsourced services
...
A go-to-market pitch describing the key value positions for go-to market
...
Technical pipeline and deployment model for the production of VIVO data and hosted VIVO sites. A deployment model under consideration is a full pipeline at Research Graph, including VIVO hosting. Duraspace would handle promotion, sales, customer relations, and billing
...
Cost model for one-time and annual pricing for small, medium, and large size seed data sets. This includes analysis of the resulting graph size from various seed data sets
...
Staffing model, describing the roles which would be required to set up, operate, and support the service, and the division of labor between Research Graph and DuraSpace
...
Pilot Assumptions and Risks
...
Proposed Pilot Timeline and Effort
...
The following effort is estimated for the Pilot Team during the term: Market analysis and service definition lead (10%), Project manager (10%), VIVO subject matter expert (10%), Duraspace technical resource (20%), Research Graph subject matter expert (5%), and a Research Graph technical resource (20%). We recommend The Pilot Team meet with pilot organizations weekly during the term, forming the Cloud Pilot Working Group.
...
Research Graph Home Page. http://researchgraph.org. Accessed December 2, 2017.
Conlon, Michael, and Amir Aryani. “Creating an Open Linked Data Model for Research Graph Using VIVO Ontology,” July 24, 2017. https://doi.org/10.4225/03/58ca600d726bd.
The pilot can be conducted with its pilot sites, a market analysis conducted, and deliverables successfully produced without risk to the pilot itself. The risk is to the resources used in the pilot, which may be to no avail if the market analysis indicates that there is no market for the service.
Pilot sites may wish to commit additional effort in order to achieve local goals deliverables.