
VIVO Documentation
Old Release
This documentation relates to an old version of VIVO, version 1.9.x. Looking for another version? See all documentation.
In progress
The writing of this page is in progress. If you have ideas, questions about what has been written, suggestions, etc, please contact Mike Conlon
The VIVO Capability Map provides a visual means for finding people working in particular areas and for navigating through concepts and people. Using the capability map, one might find people to invite to a workshop, colleagues for a grant application, members of a dissertation committee, or experts for a technical advisory group. The map is very easy to use.
The capability map was originally developed by a team at the University of Melbourne for their VIVO, Find an expert. The concept was developed for OpenVIVO and introduced to VIVO in version 1.9.0.
The capability map uses D3.js, a visualization tool used by the NY Times and others to provide modern graphics that are interactive, and responsive – that is, work on any device in any modern browser from a phone to a desktop computer.
In the examples that follow, we will use OpenVIVO. If your local VIVO is at version 1.9.0 or higher, it will have the capability map as described here.
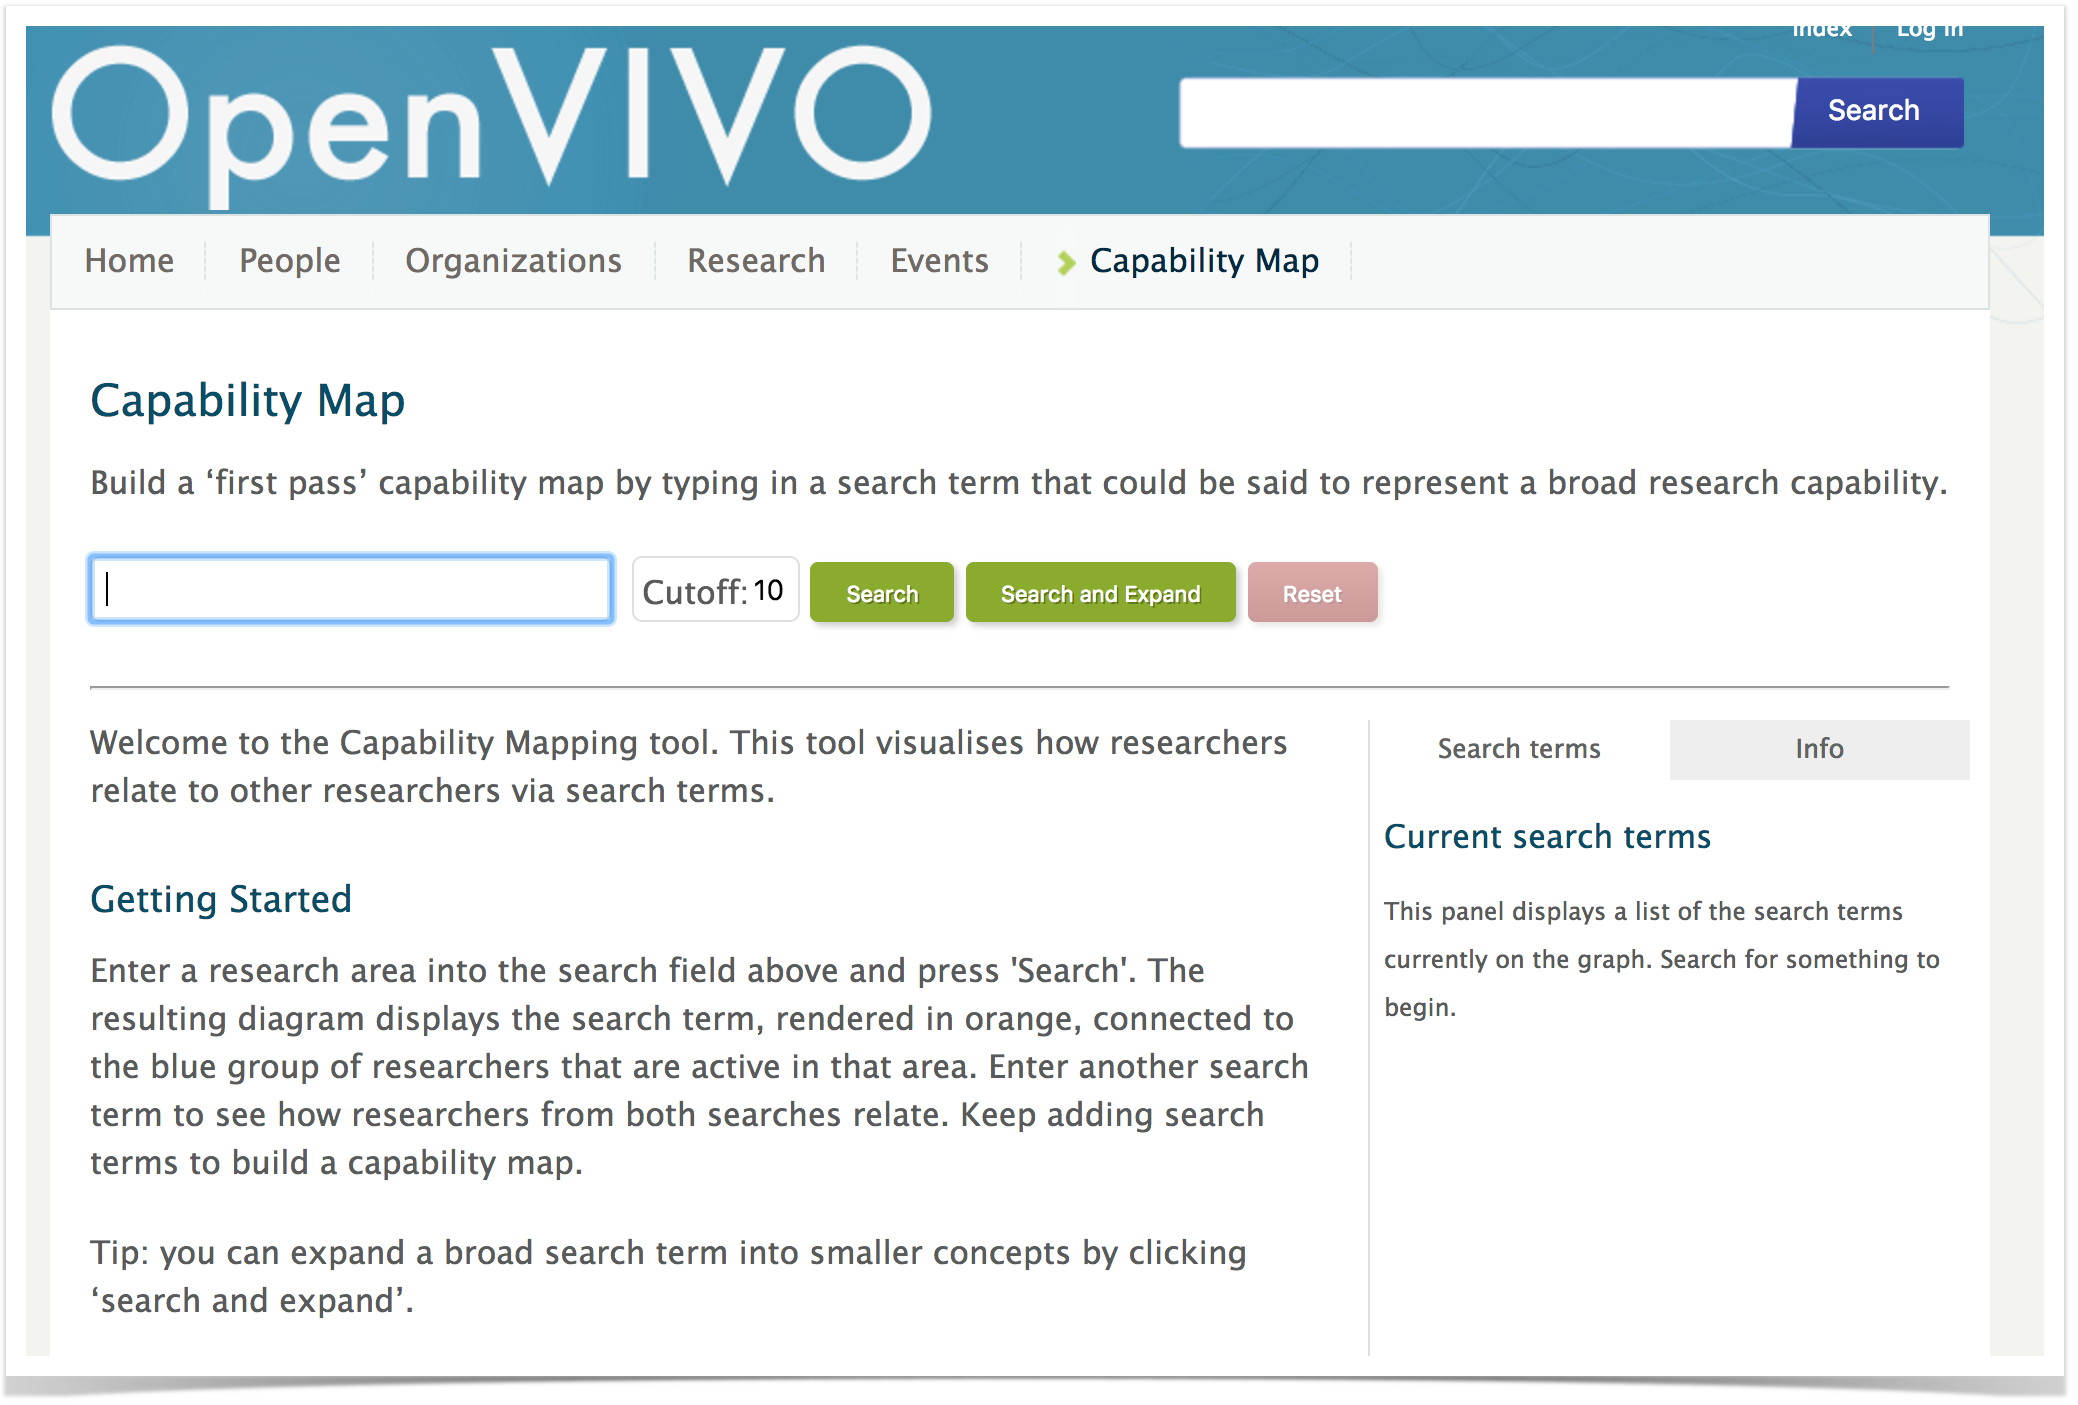
Think of a research area that interests you. Perhaps you study ontologies and want to find other people who are interested in ontology. Click on the Capability Map link in the menu bar on the VIVO home page (see below). You do not need to be logged on. If you are using your local VIVO and you do not see the capability map link on the home page, please contact your local VIVO support for more information.

You will see the Capability Map page. Everything you do with the Capability Map will be done from this page. There are directions on the page. You'll want to read them all. Scroll down the page to see the rest of the directions.
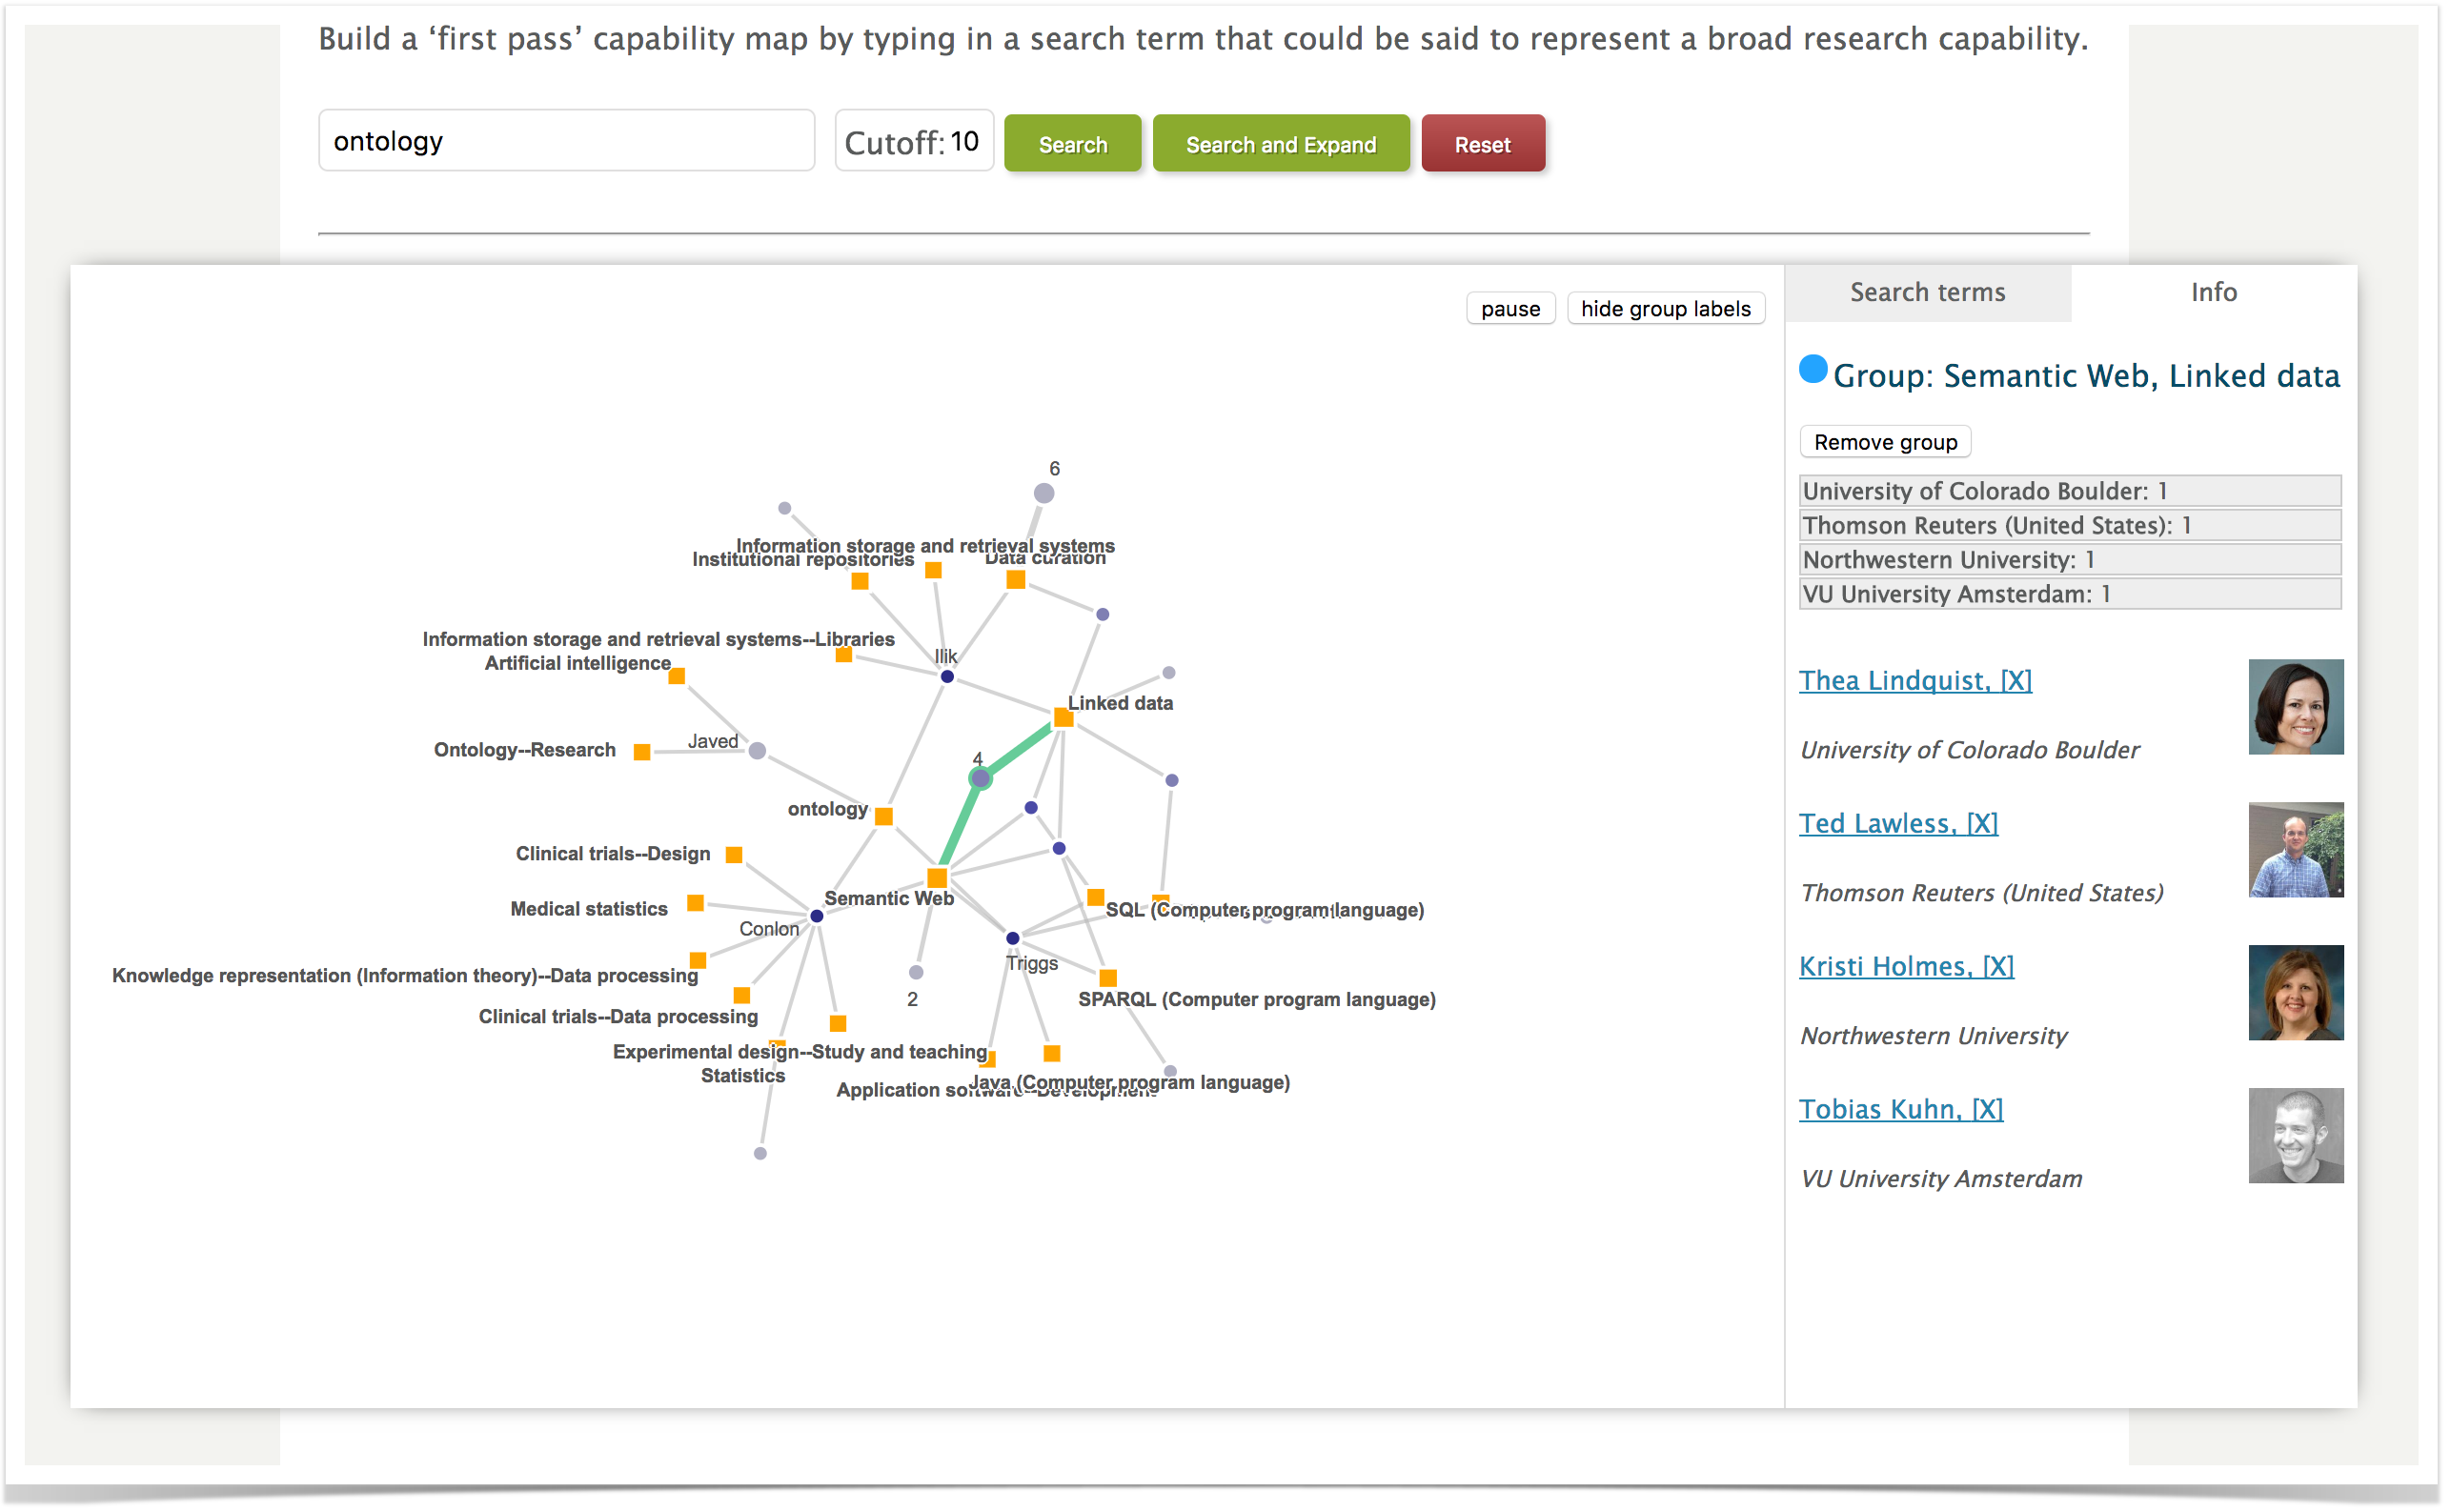
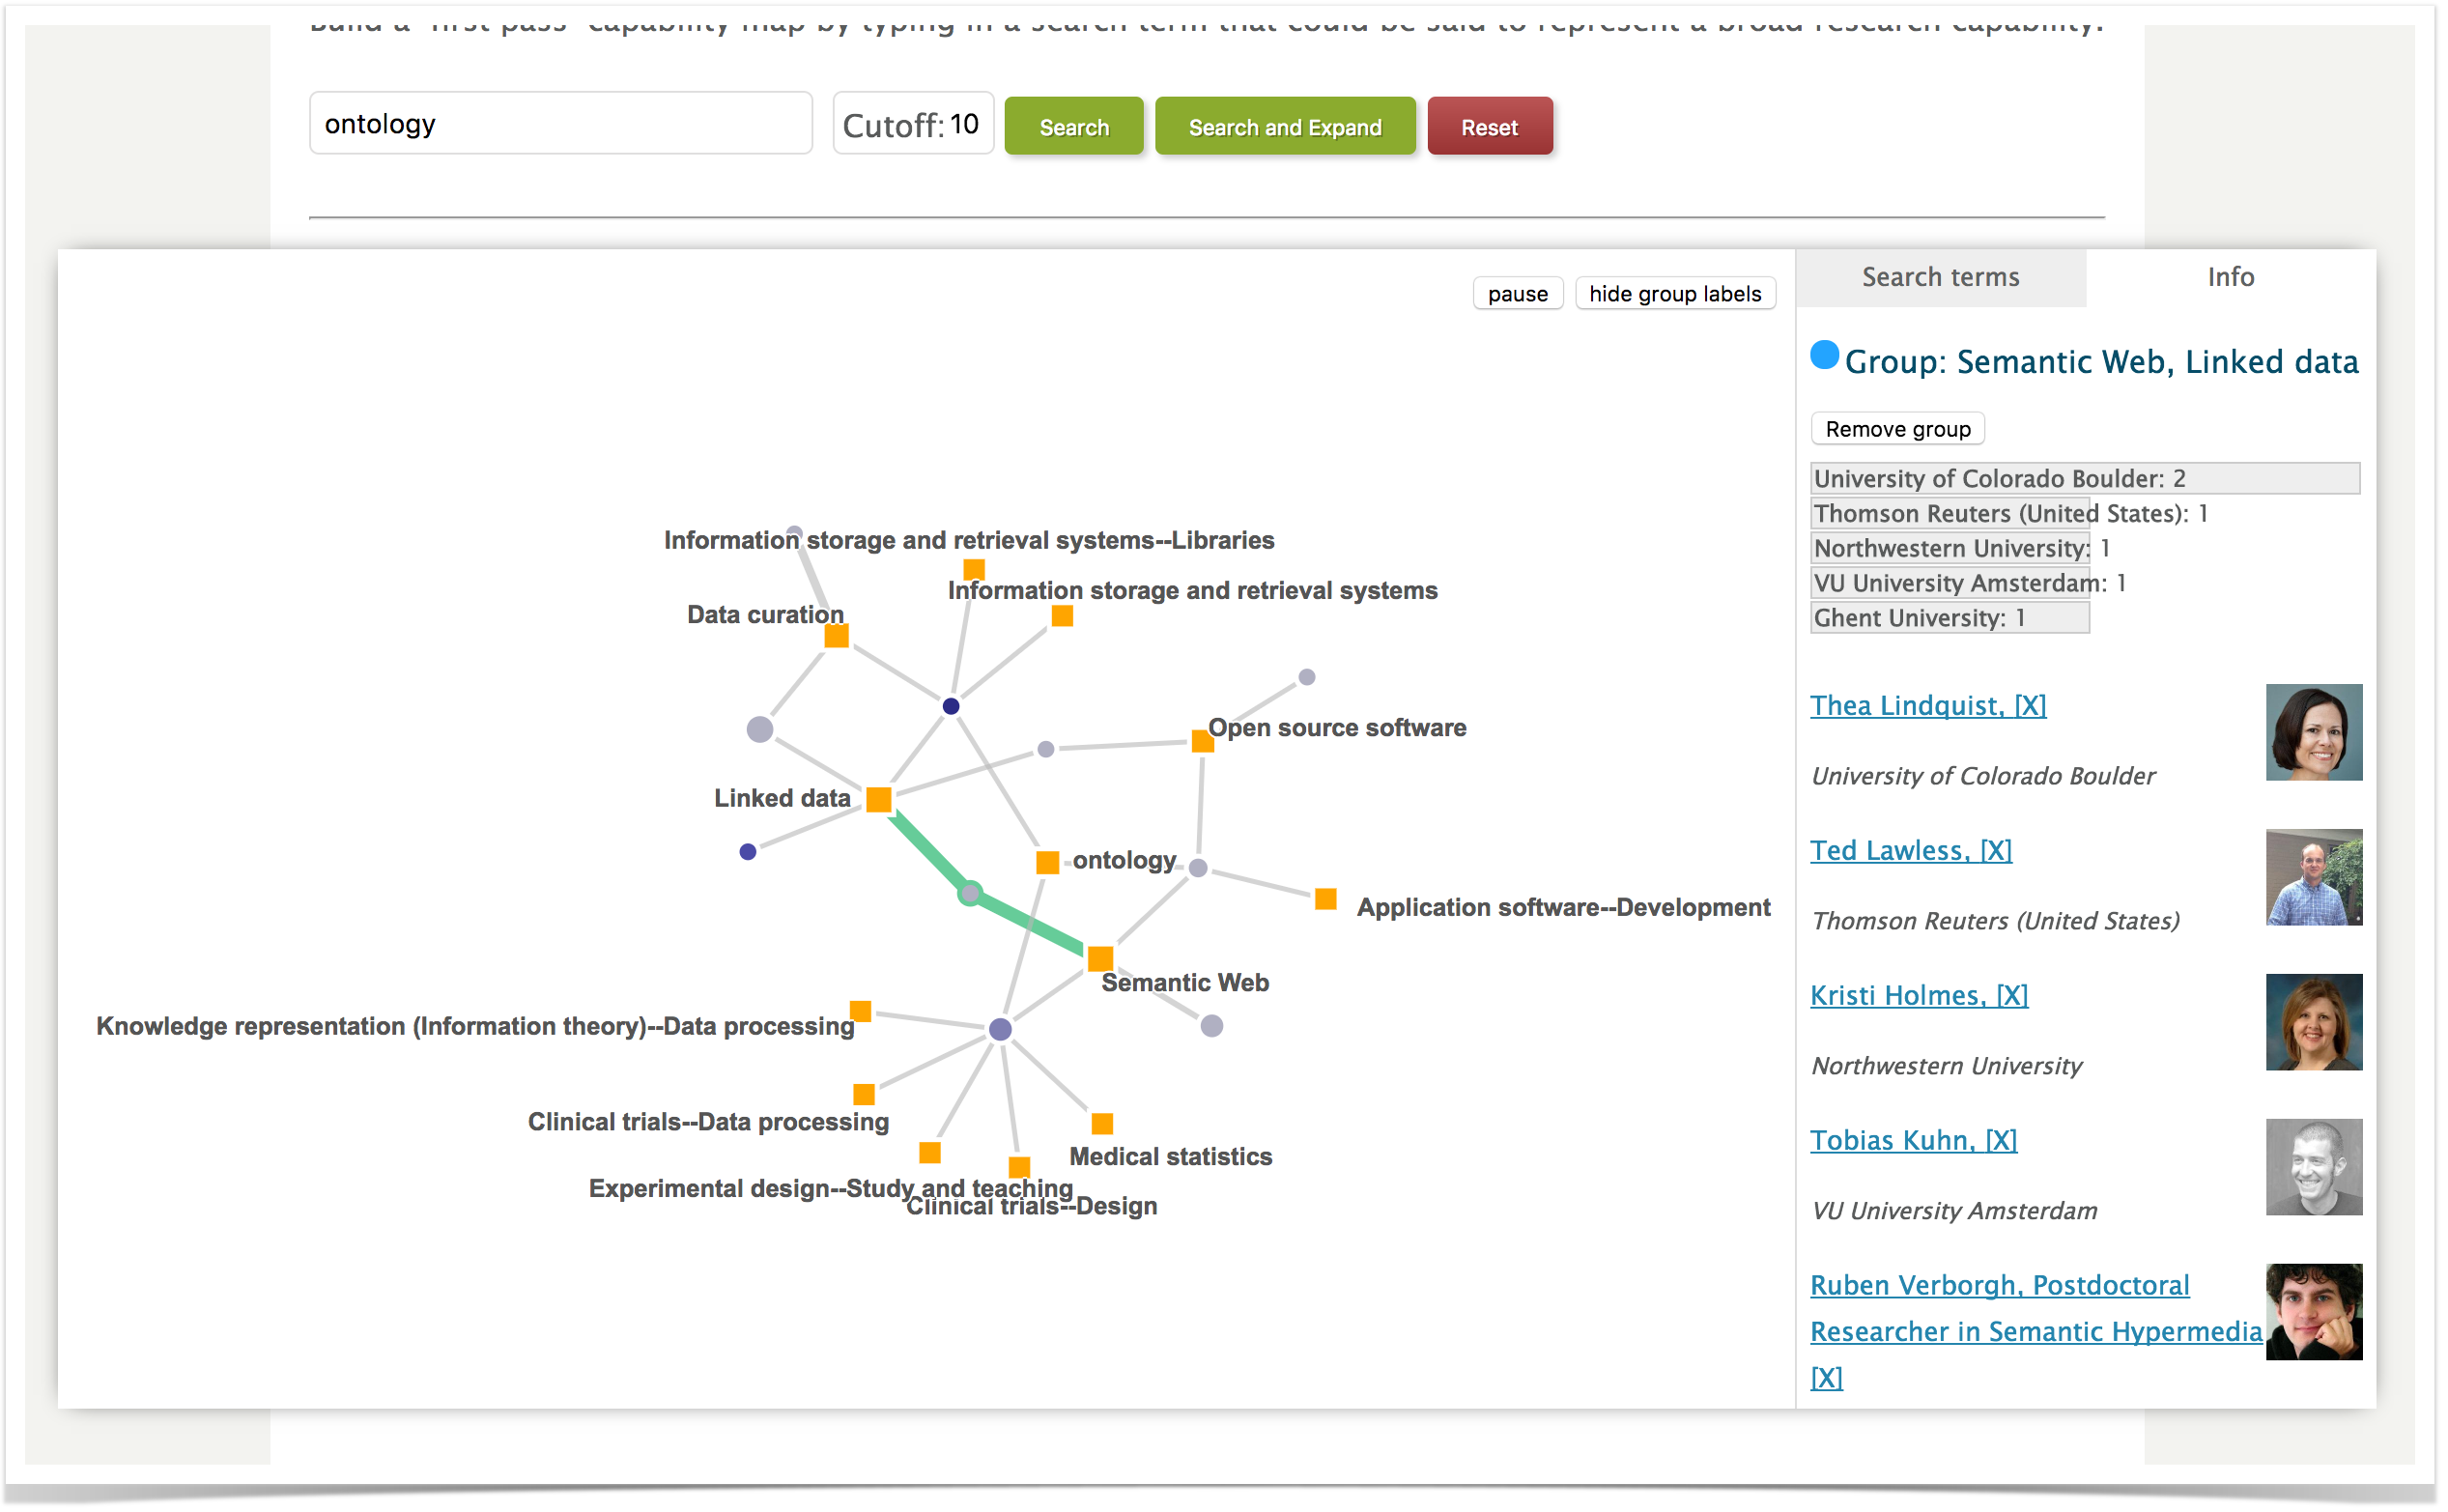
Type ontology into the text box and press Search. You should see something similar to below. OpenVIVO is a VIVO anyone can join. As a result, the data in OpenVIVO at the time you are following these examples may be different from the data at the time the examples were captured for this document.
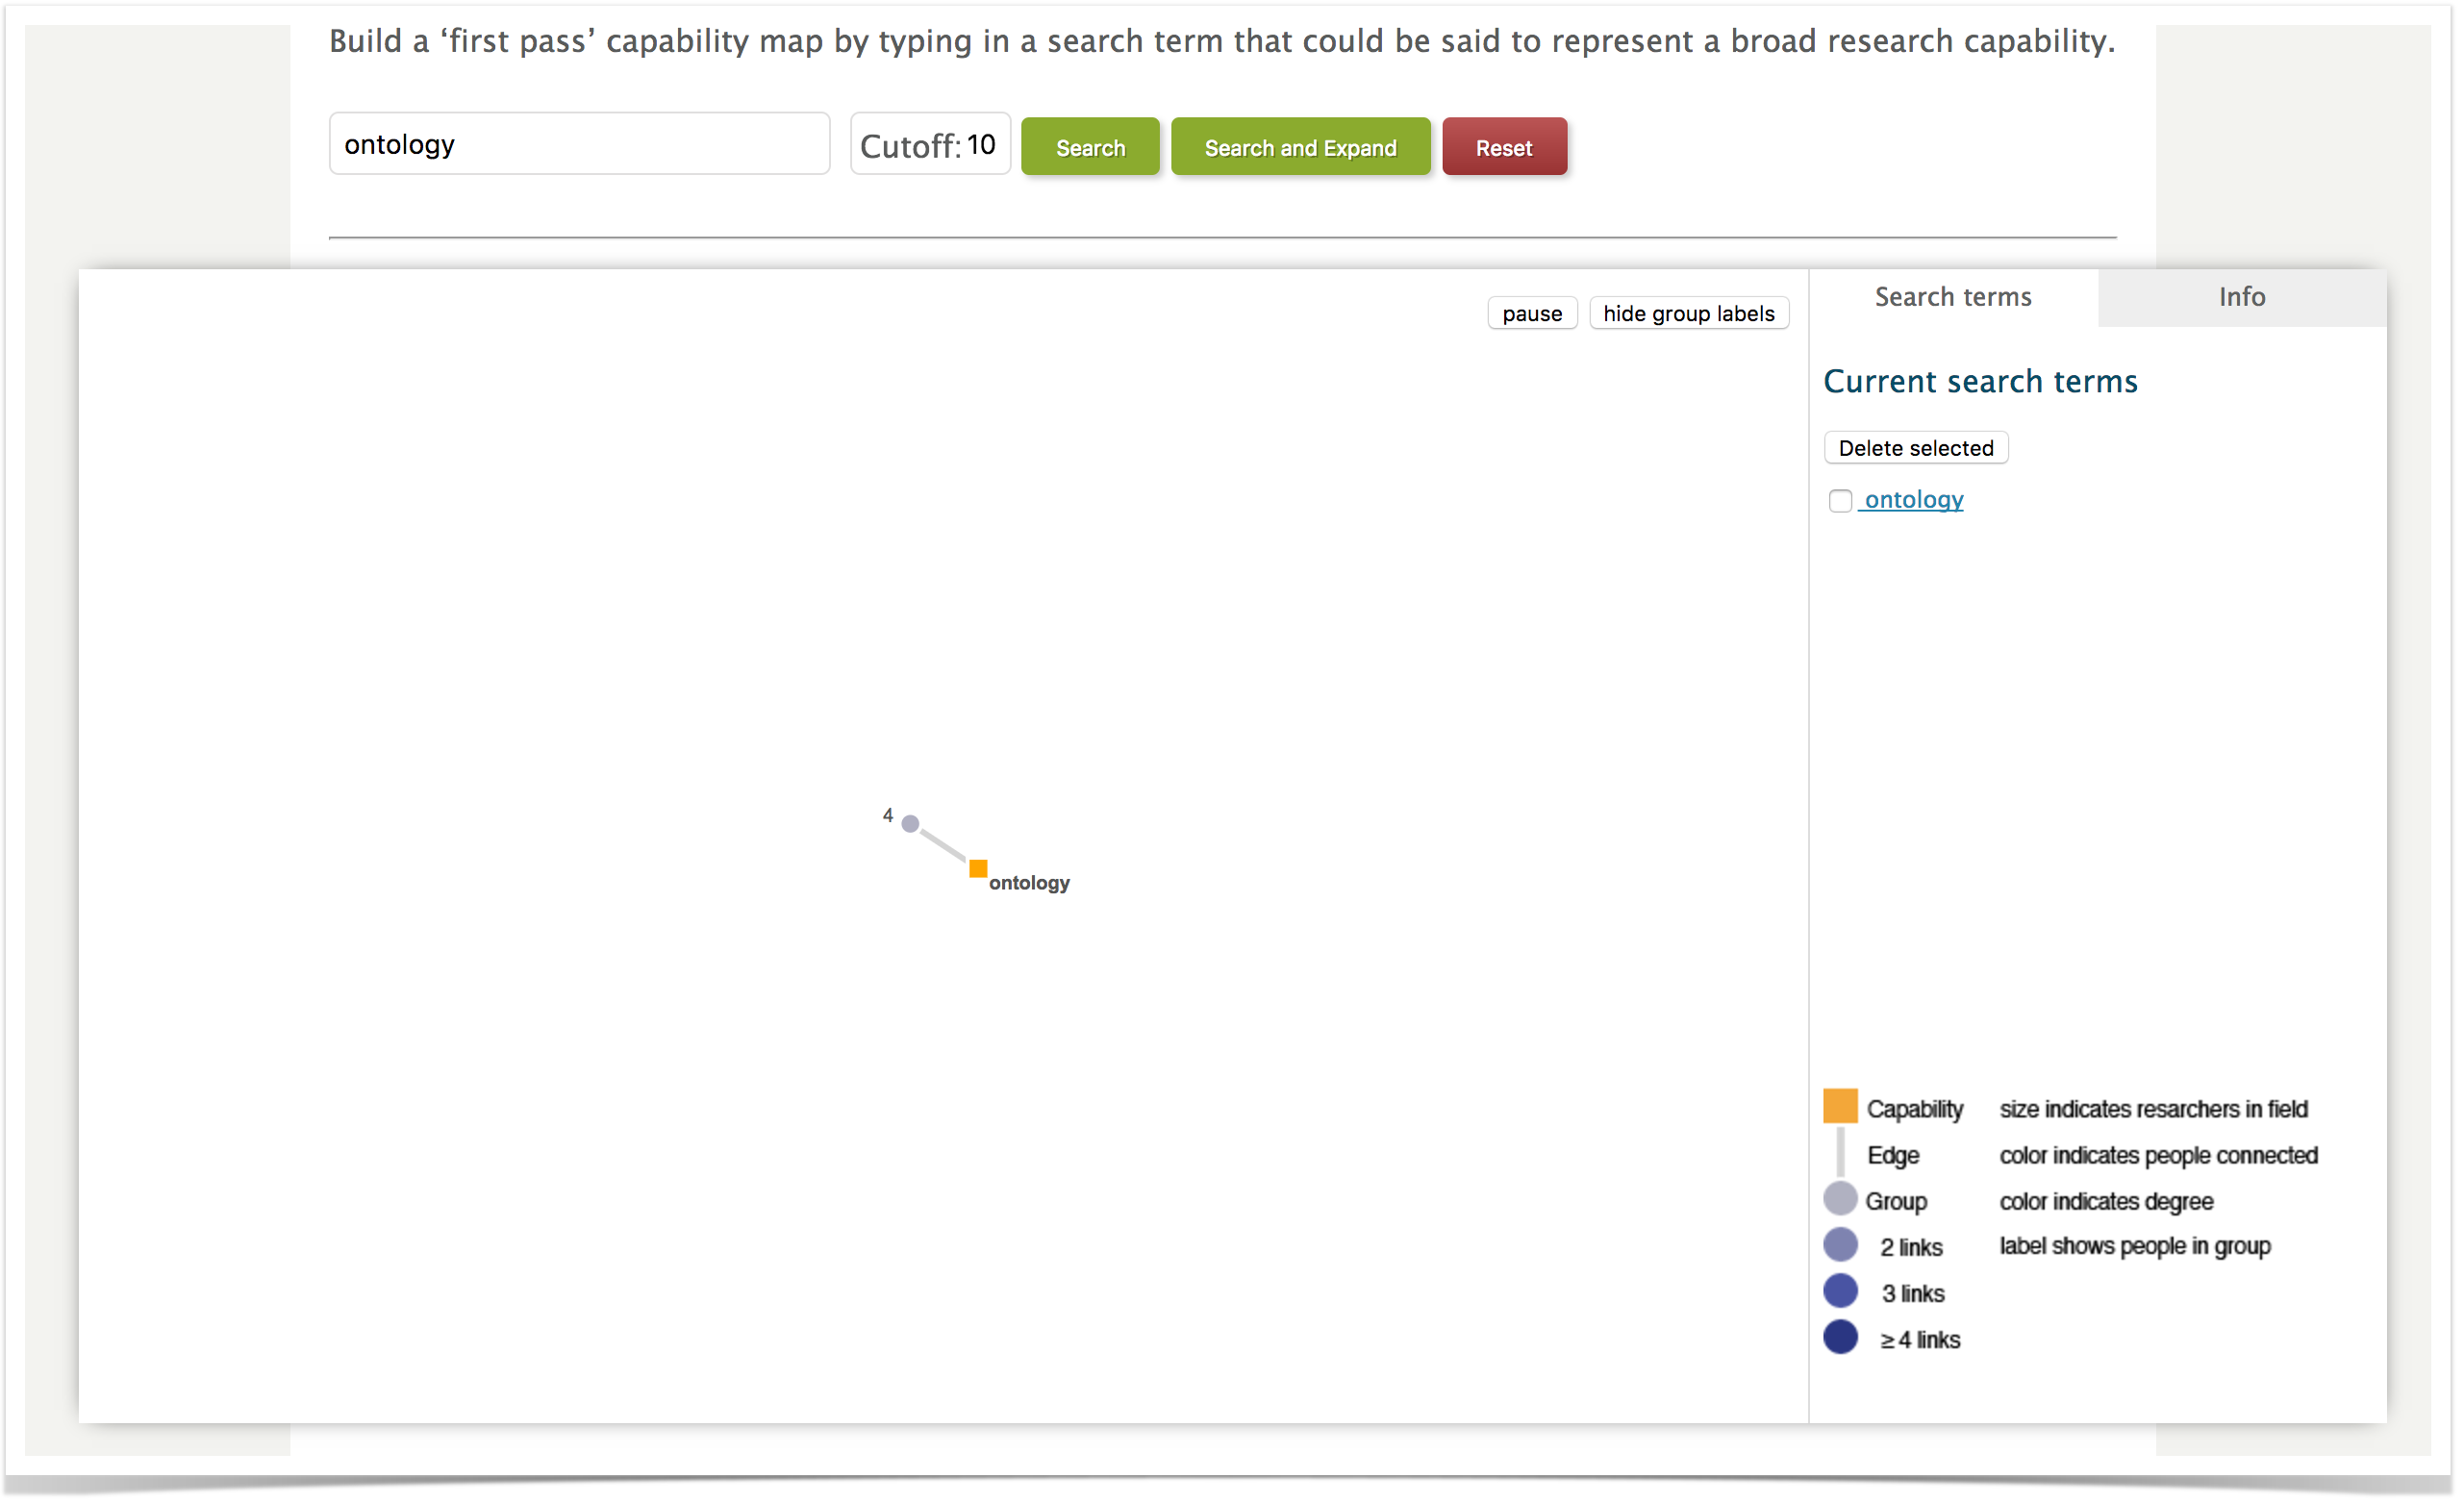
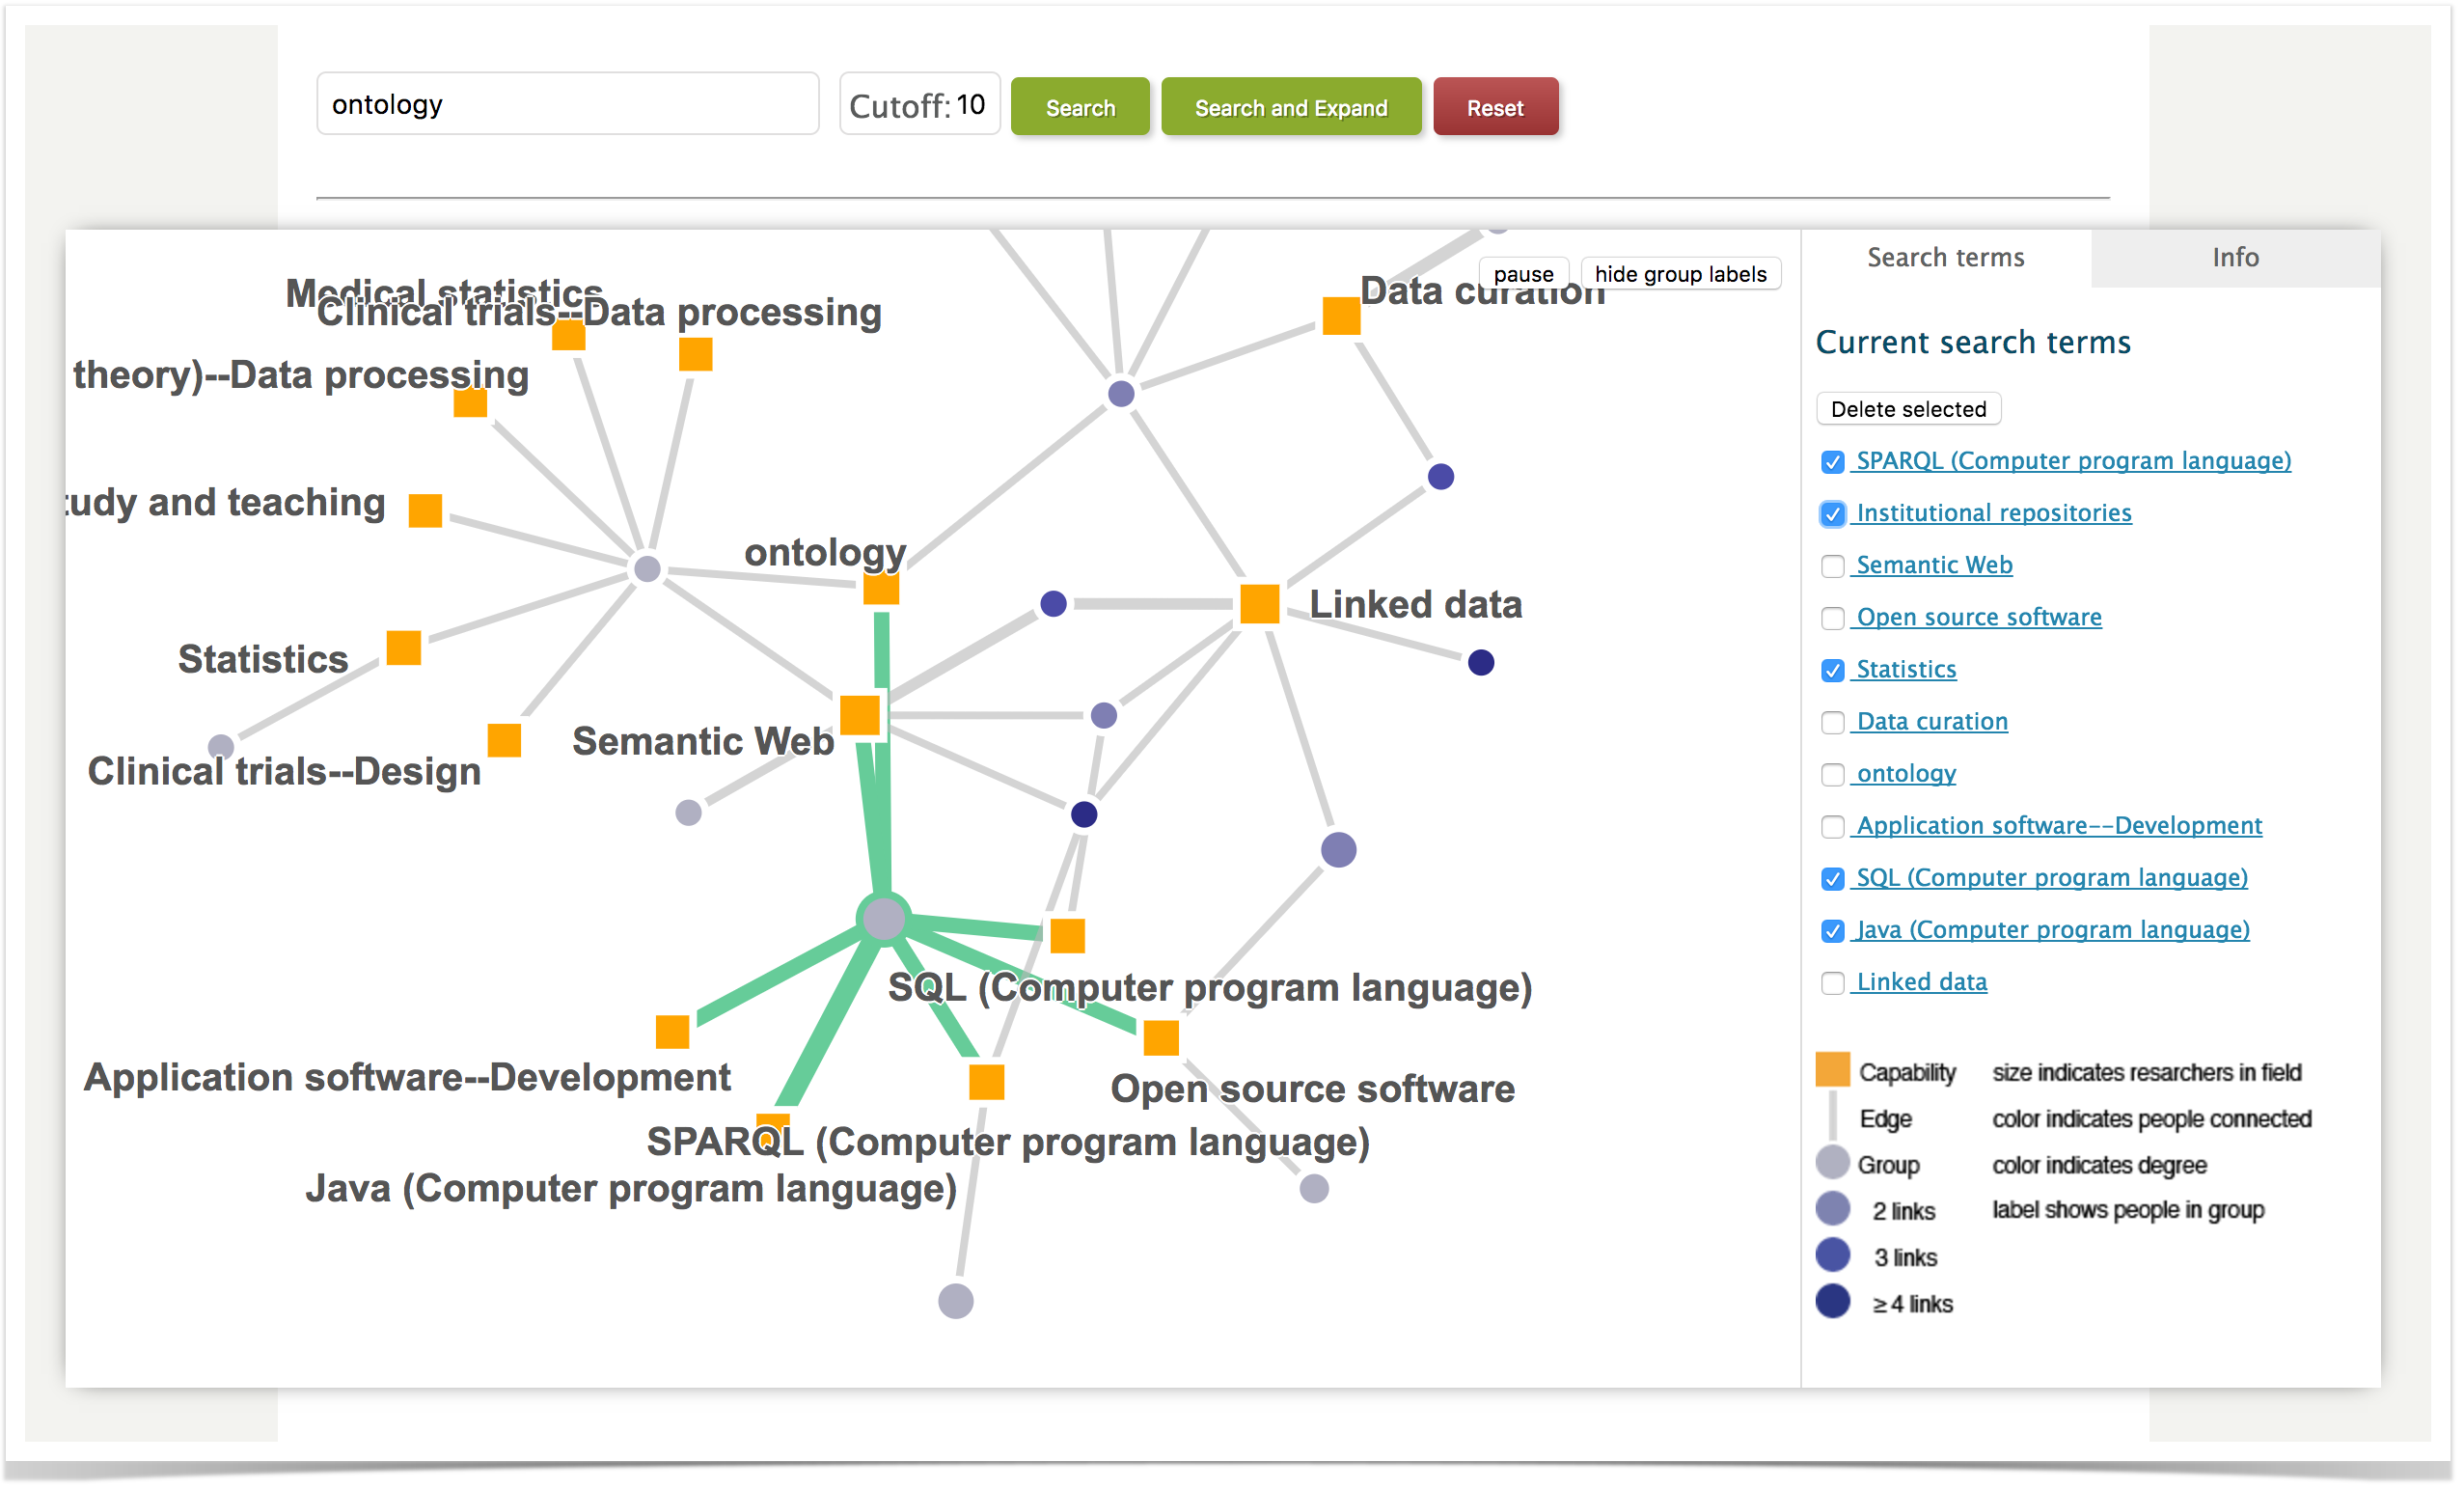
Doesn't look like much, but we're just getting started. we have a very simple "graph" – a network diagram. The diagram has a legend in the lower right. There are three kinds of things on the graph: 1) terms or capabilities (orange squares); 2) groups of people (purple circles), and 3) edges (grey lines). Terms or capabilities are also called "research areas" or "research interests". They are concepts that are associated with individuals through works such as publications, grants, datasets and presentations, and through self-identification. People with VIVO profiles can select their research areas of interest using the profile editing features of VIVO. Each orange square represents a concept, and each is labeled. The purple dots represent groups of people. People are in the group if they have the research interests that connect to the group. In the figure above, there is just one concept – ontology – and just one group – the group of people with ontology as a research interest. Note the number of people in the group is shown (4). If there is just one person, the person's name will be shown. The edge indicates that the people in the group are "connected" to the term.
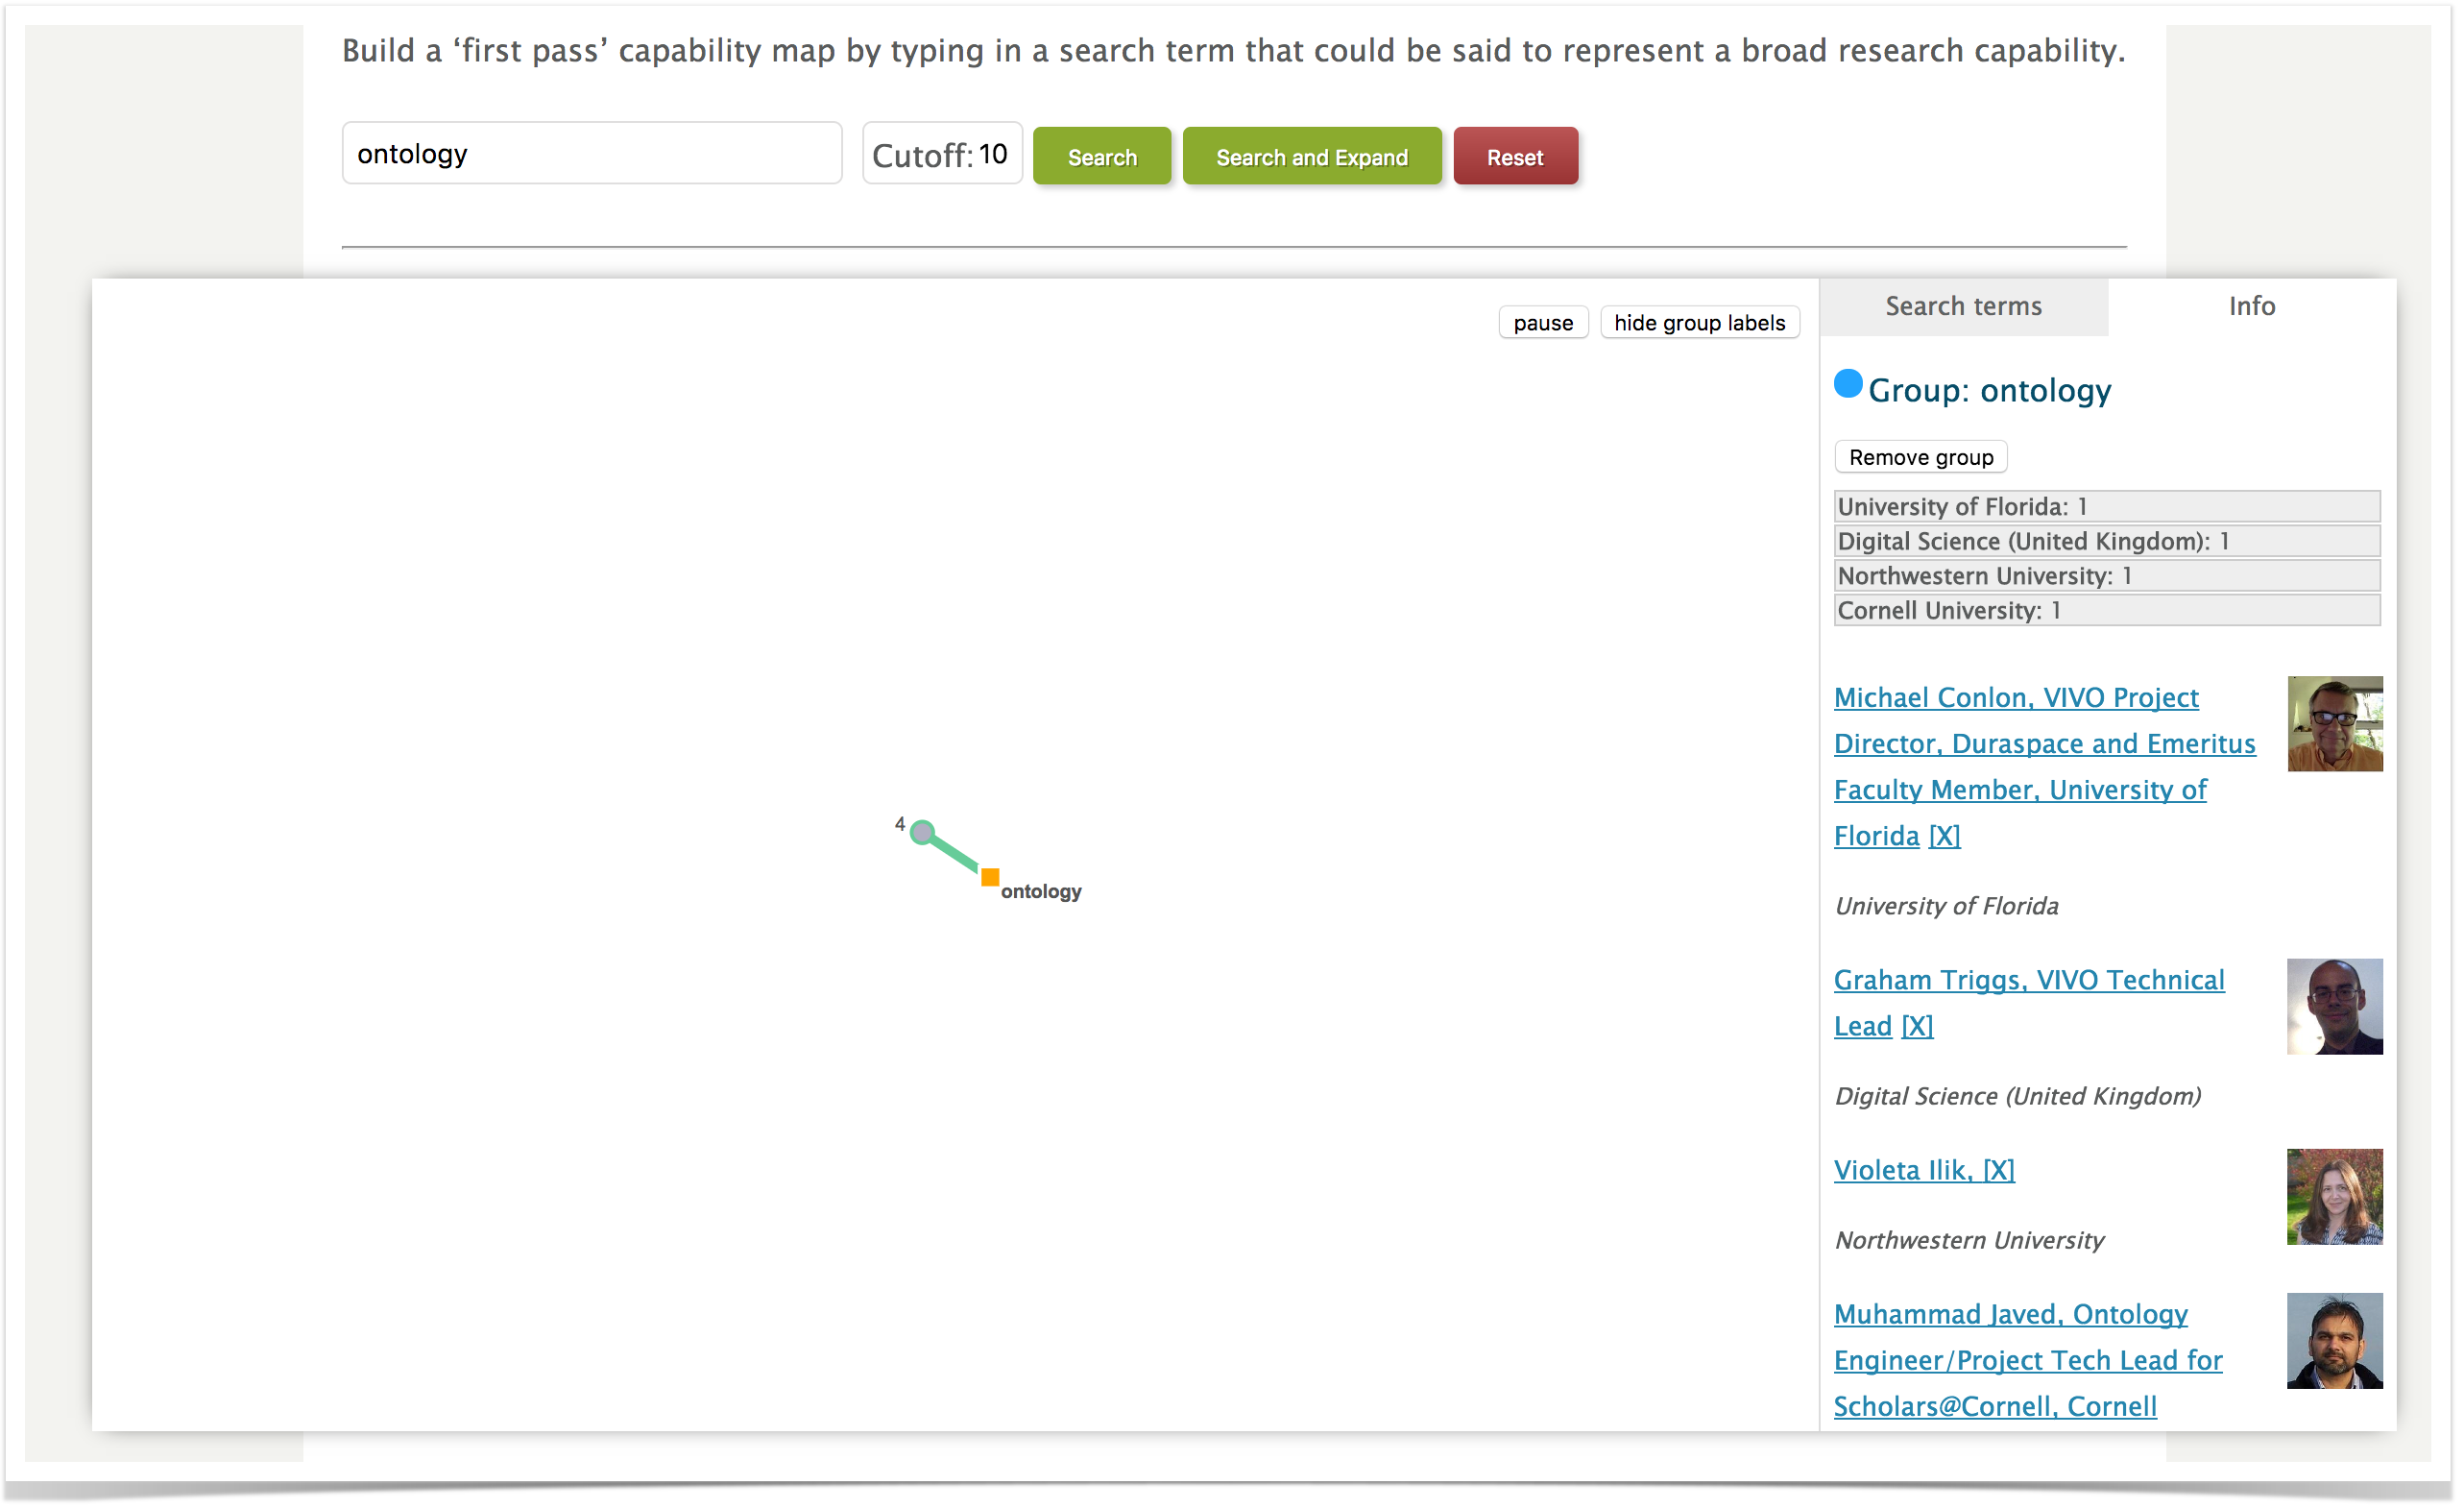
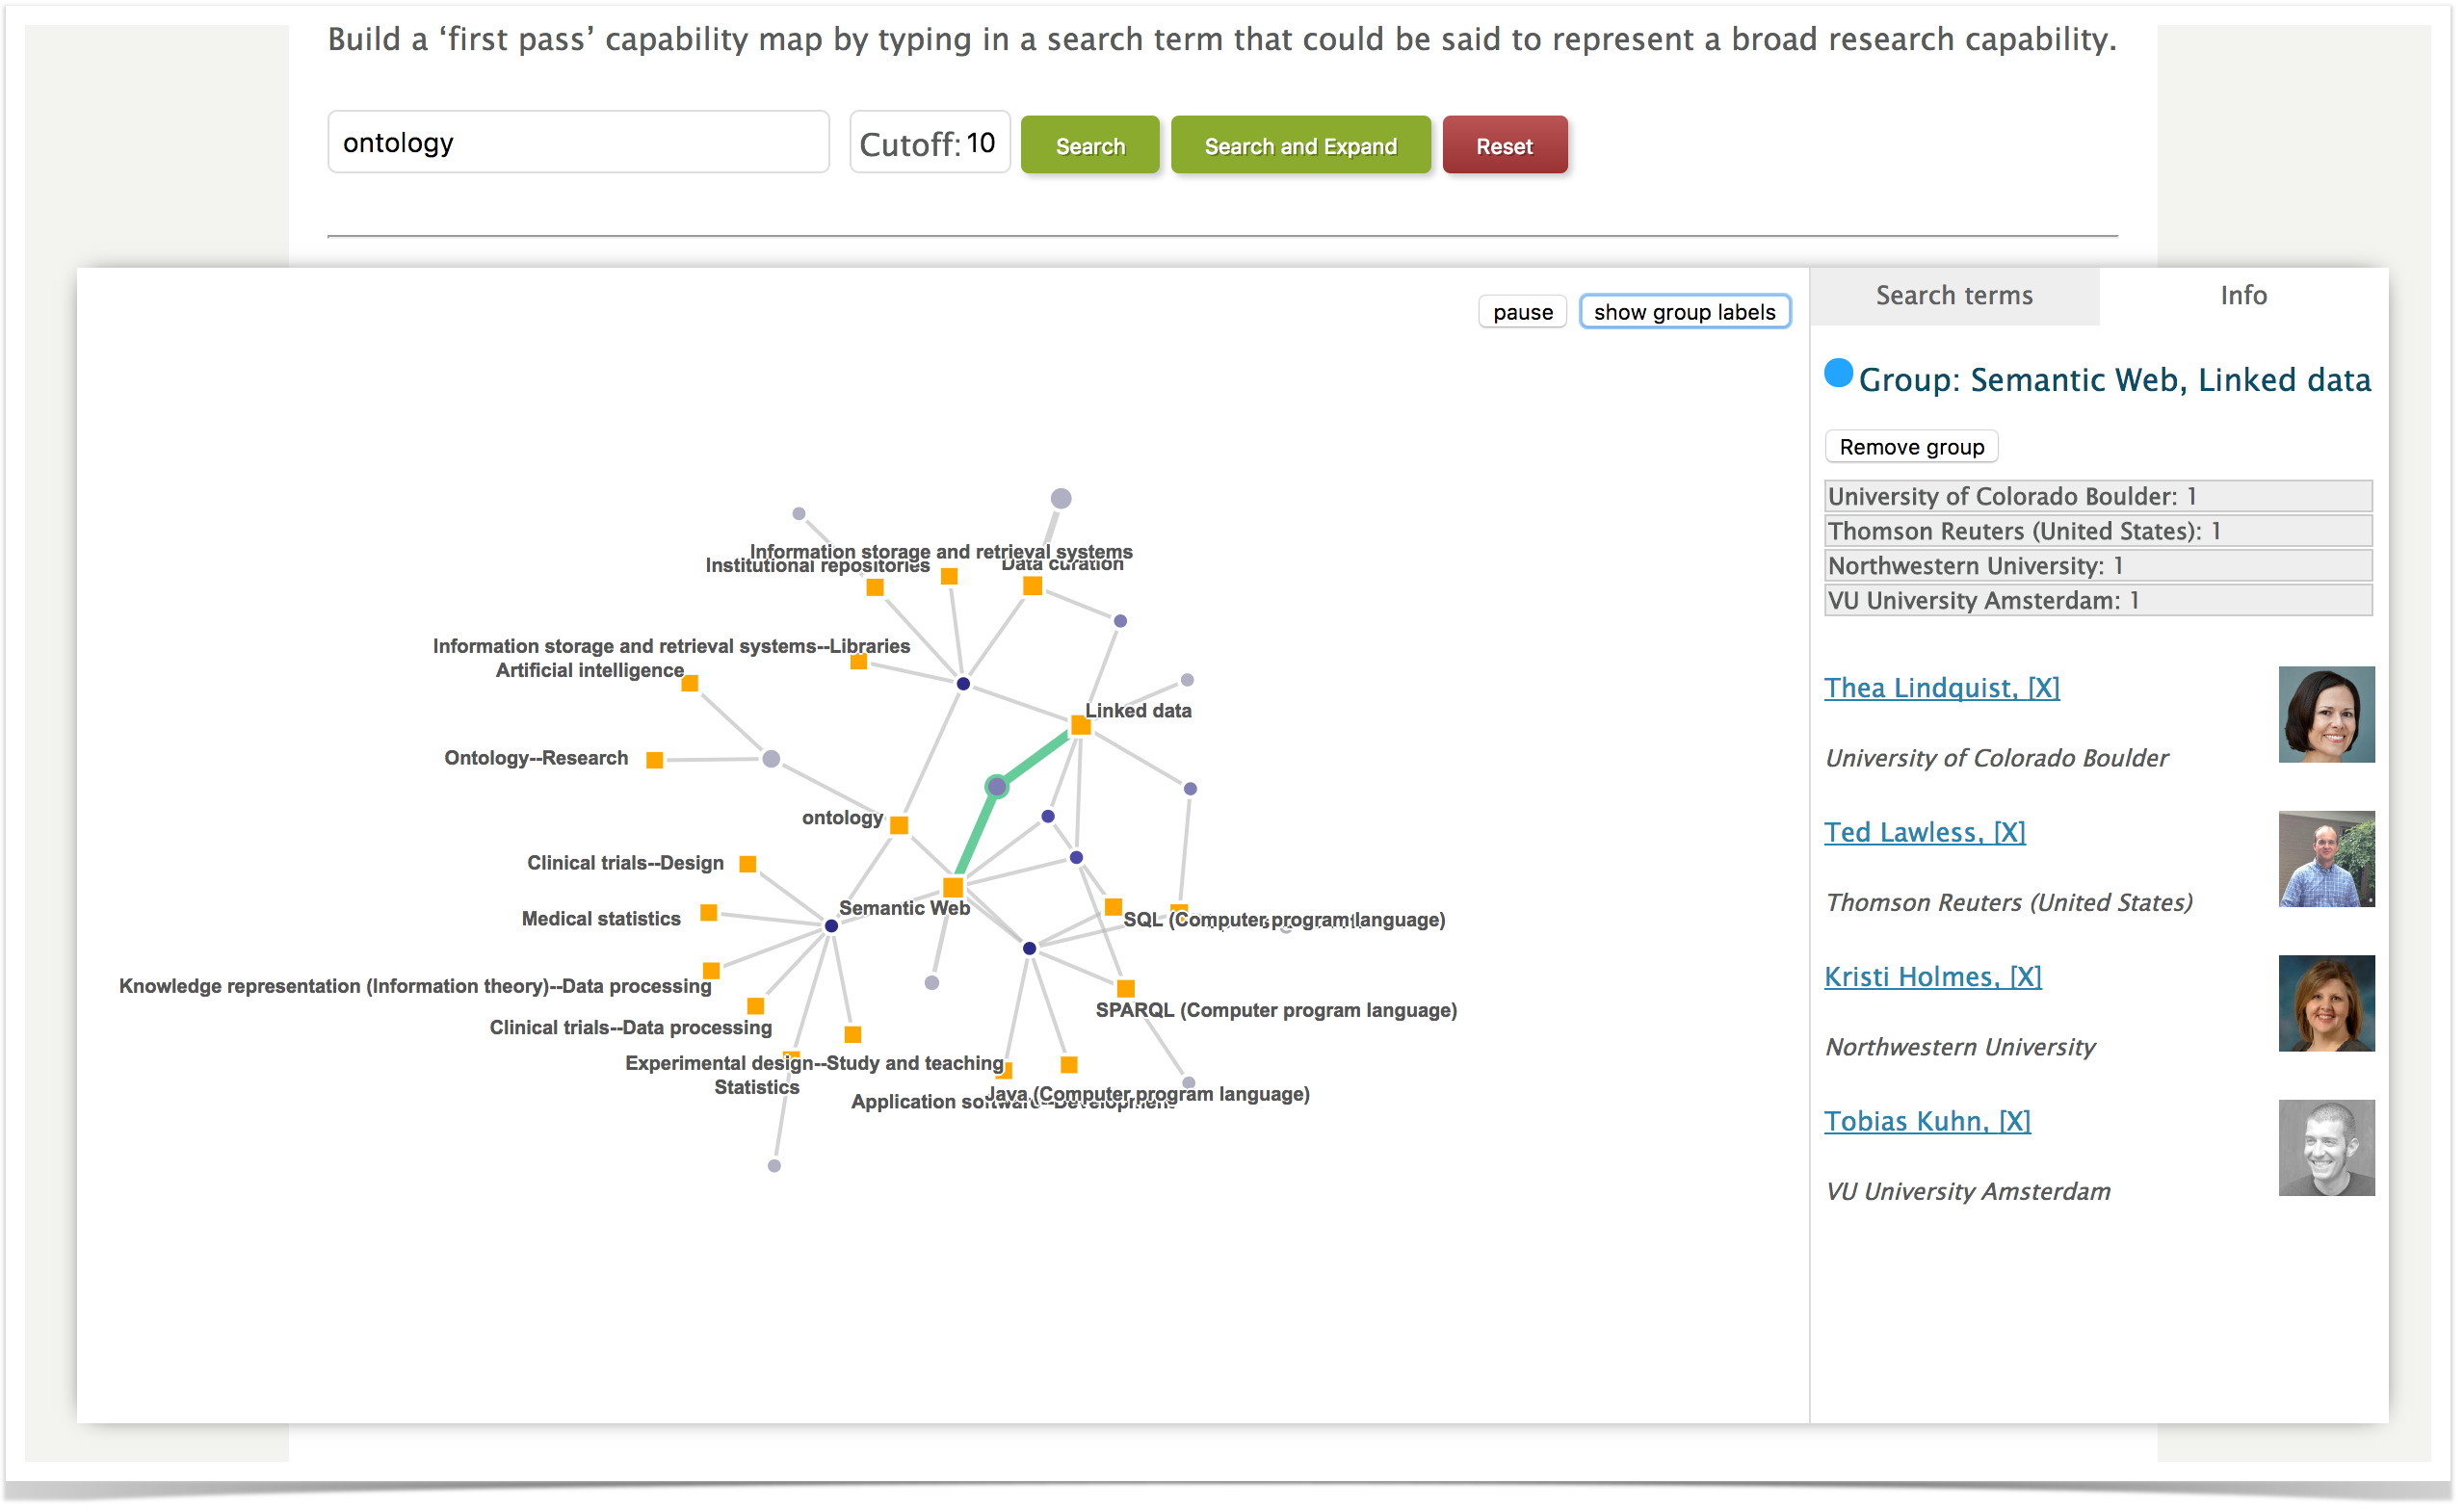
Click on the group of people. The right hand area indicates the people who are in the group. You can click on any of them to go to their VIVO page.
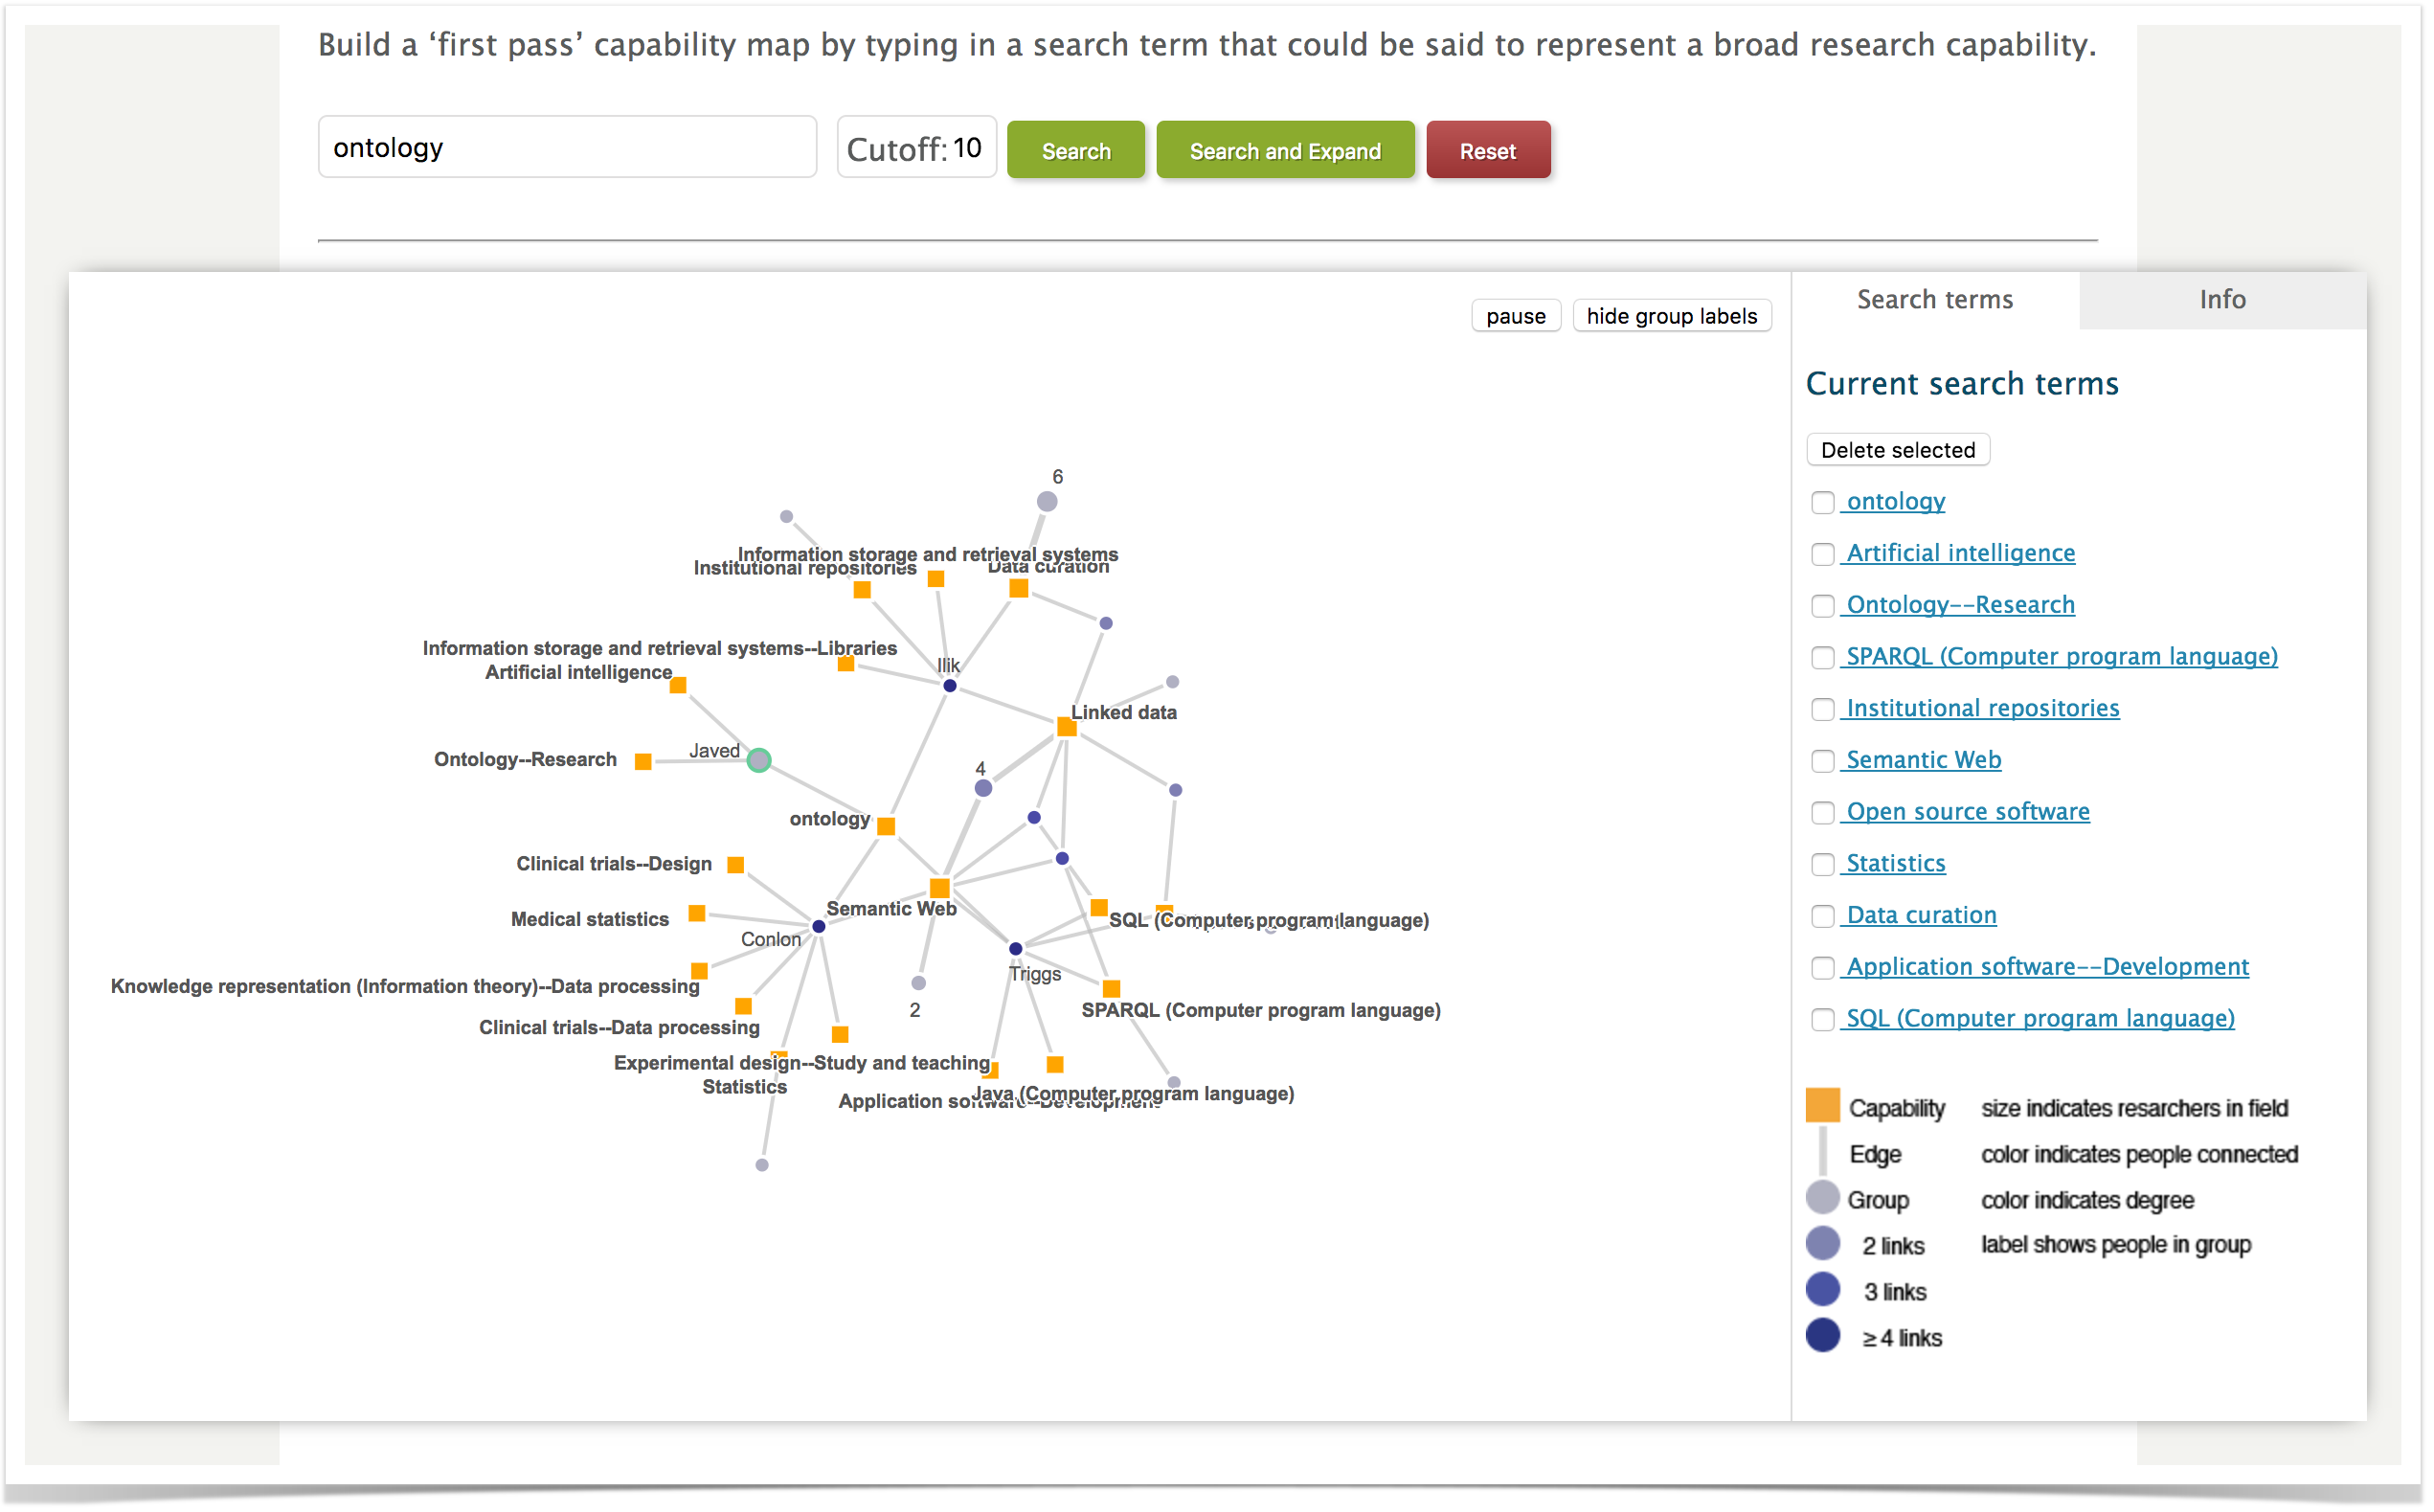
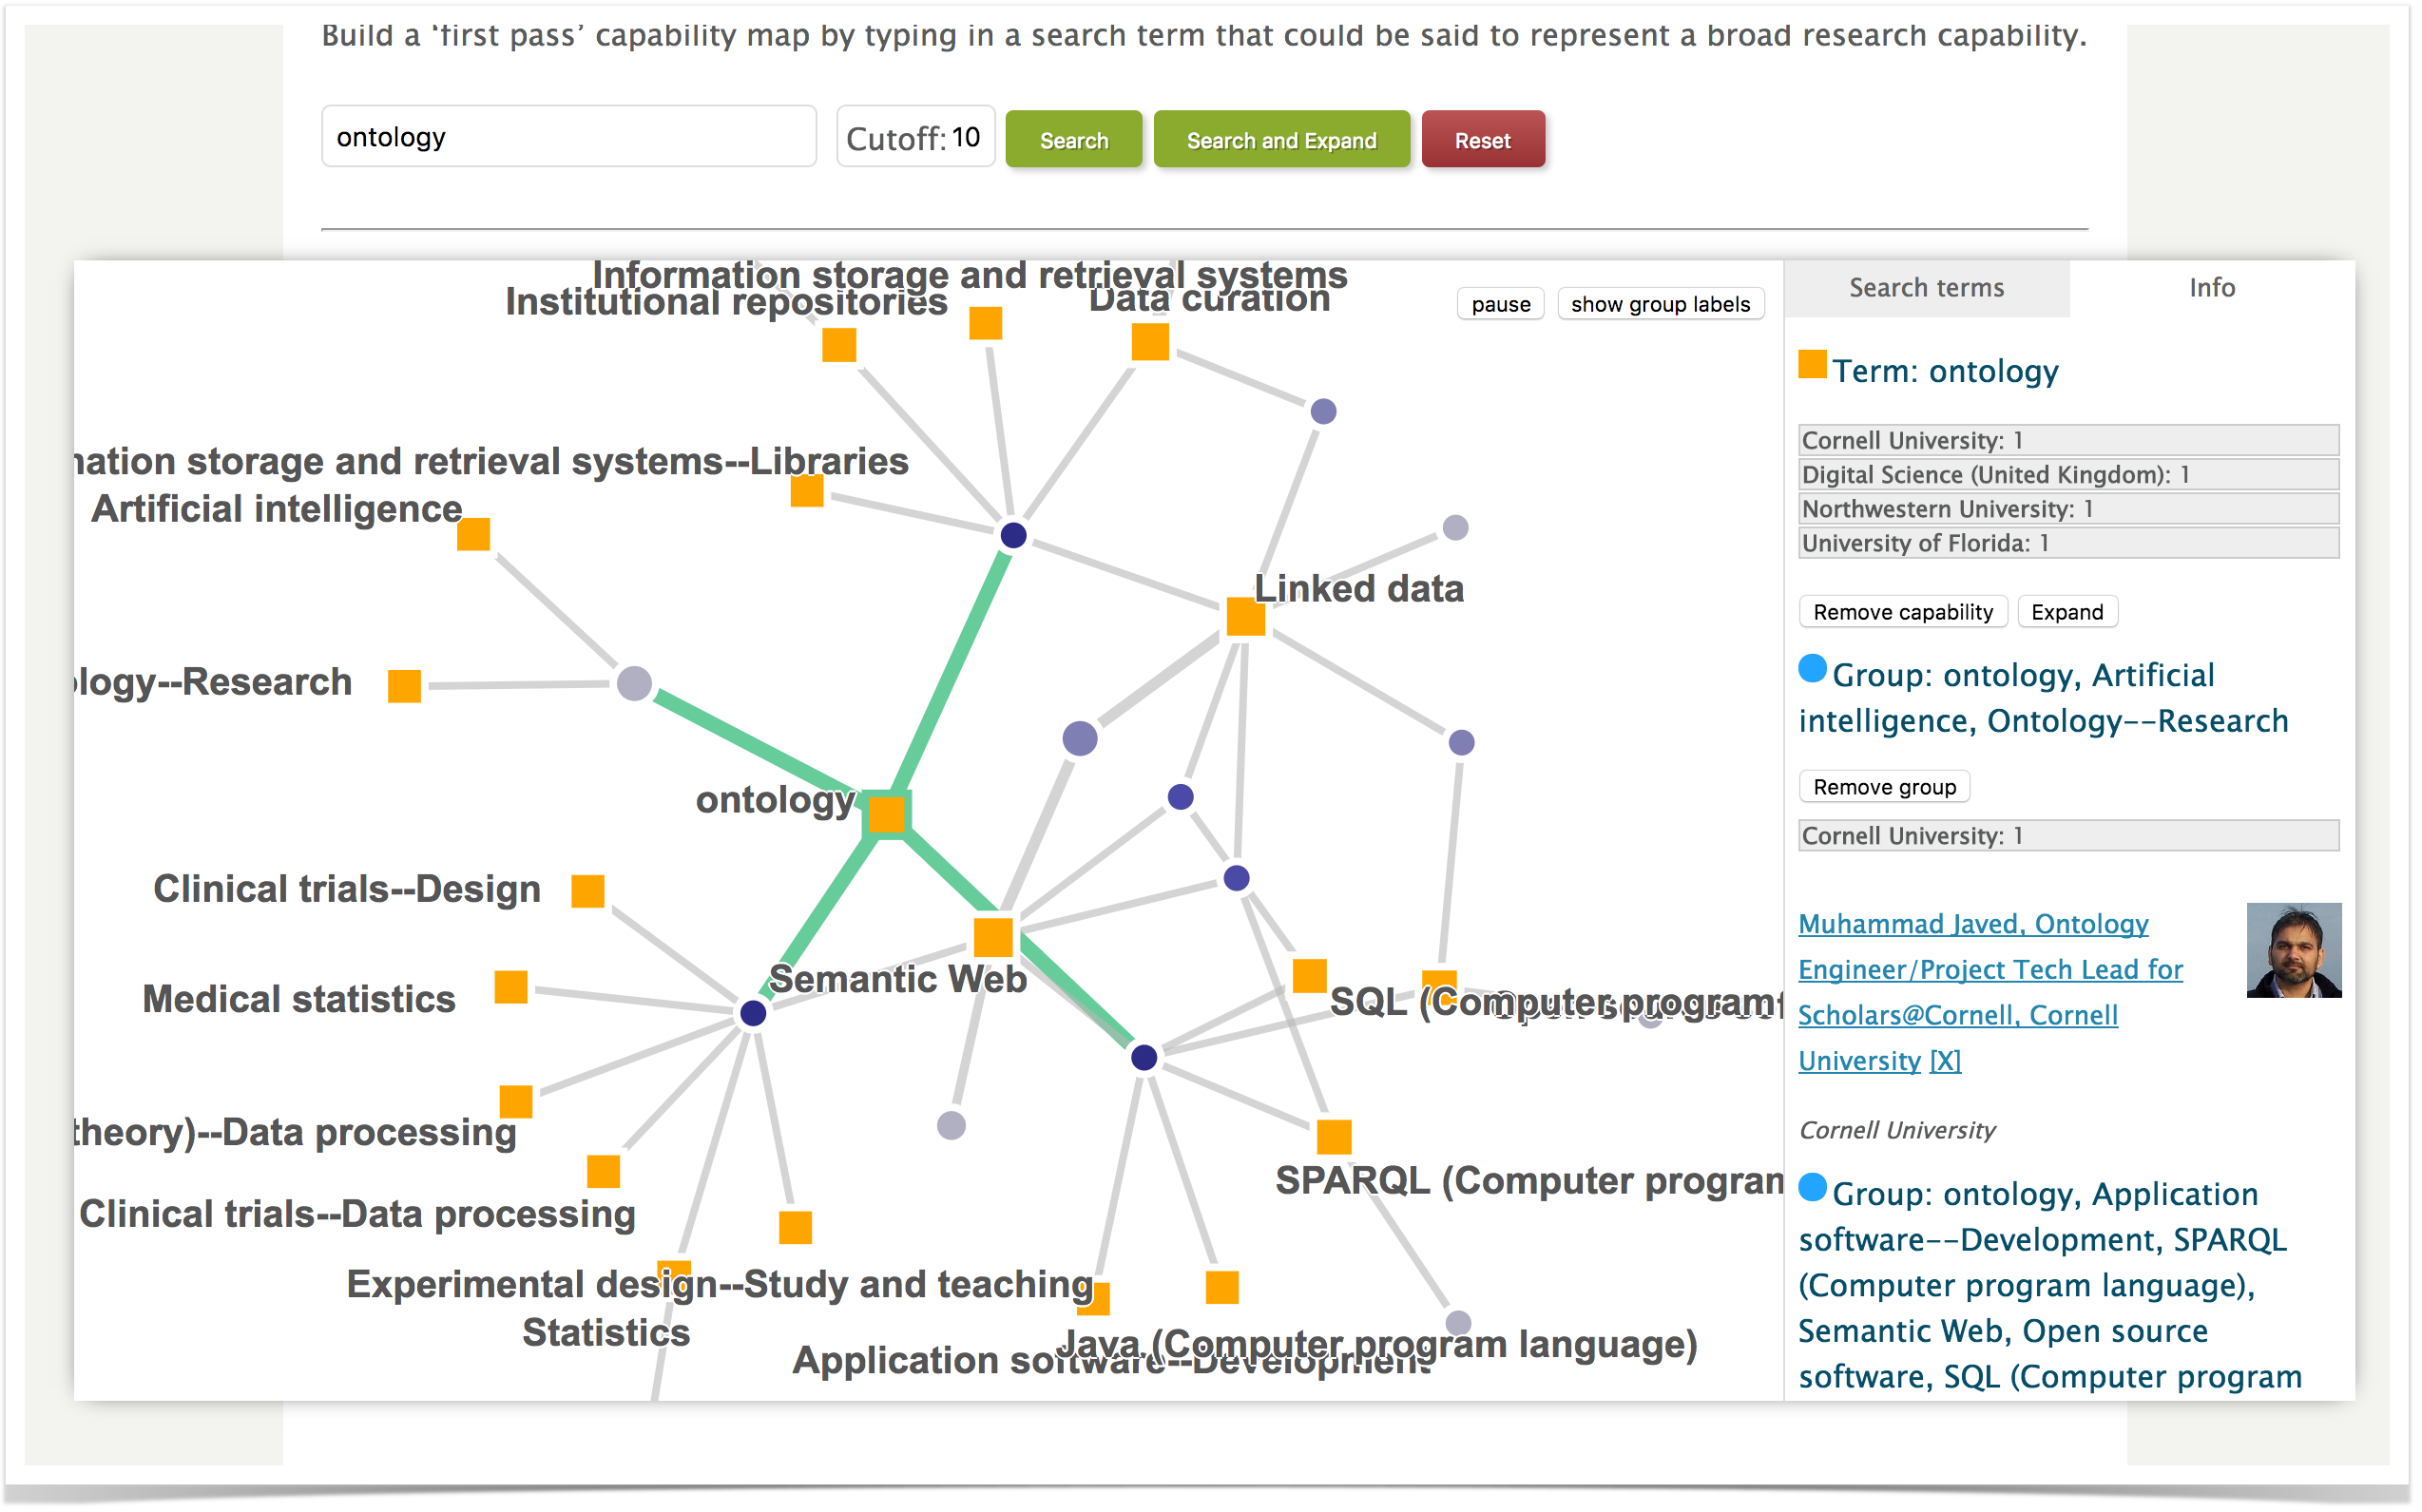
Let's add to the network. Click on Search and Expand. We now see the concepts of each of the four original people, with people associated with those concepts, connected in a graph showing common interests. Some people have many interests, some have just a few.

All content on the LYRASIS Wiki is licensed under the CC BY (Attribution) license![]() , unless otherwise noted.
, unless otherwise noted.