Network definition
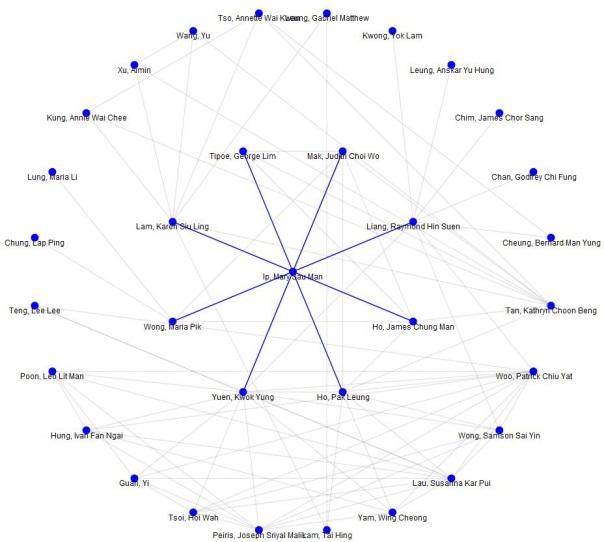
The system is able to draw graph about network collaborations, see “Network visualization”, between Researchers using data in the RPs, Projects, OrgUnits, Dynamic Objects and DSpace Items.
The system use the Jit javascript library (http://thejit.org/ ) to draw the graphs. A customized version of the RGraph layout has been developed. This customization changes the positioning algorithm of the nodes. Nodes are equally positioned in the “circle” corresponding to the degree of the relationship and not limited to the area of circle “assigned” to the intermediate node at the previous level. Below there is a comparison between the DSpace-CRIS customization (on the left) and the standard RGraph layout.

The relationships that are used by the system to build the network are defined as plugin in the network.cfg file. All the connection-type needs to implement the org.dspace.app.cris.network.NetworkPlugin
plugin.named.org.dspace.app.cris.network.NetworkPlugin = \
	org.dspace.app.cris.network.VisualizationGraphCoauthors = coauthors,\
	org.dspace.app.cris.network.VisualizationGraphInterests = interests,\
	org.dspace.app.cris.network.VisualizationGraphKeywordsPublication = kwdpub,\
	org.dspace.app.cris.network.VisualizationGraphCoinvestigators = coinvestigators,\
	org.dspace.app.cris.network.VisualizationGraphKeywordsGrants = keywordsgrants
A special, single plugin implementation is used to provide the “Department network: visualization & metrics”
plugin.single.org.dspace.app.cris.network.NetworkPlugin = \
	org.dspace.app.cris.network.DepartmentNetworkPlugin
The network.connection property define the exact order used to list the network in the UI
network.connection = coauthors, interests, coinvestigators, keywordsgrants, kwdpub
The UI load the graph data asynchronous via JSON. In the JSP UI there is a single servlet able to produce JSON for different purpose using plugins, these plugins are configured in the dspace.cfg file with the following names: collaborationnetwork, departmentnetwork
plugin.named.org.dspace.app.webui.json.JSONRequest = \
 …
 org.dspace.app.webui.cris.servlet.JSONResearcherNetworkServlet = collaborationnetwork,\
 org.dspace.app.webui.cris.servlet.JSONDeptNetworkServlet = departmentnetwork
The colors used by a specific connection-type is defined as follow

# node color
network.connection.color.node.default = #ddeeff
network.connection.color.node.interests = orange
# connection edge color
network.connection.color.edge.default = #C17878
network.connection.color.edge.interests = orange
# multi-connection edge color (only apply from the 2nd degree)
network.connection.color.edgetooverride.default = #C17878
As the number of nodes and connections in the graph grow, the graph will become more and more unreadable and less useful so the system allows to set some configuration properties that limiting the visualized data to the most important and will keep the graph more clear and fast to load.
# Max degree or relationship to show
network.connection.maxdepth = 2

# default value for the Show external people (not RP)                      # (RP Network graph & Department graph)
network.connection.showexternal = true

# default value for the show only relationships inside the department      # (Department graph)
network.connection.showsamedept = false

# max number of nodes to show, for any node in the previous level,         # on each level (degree) of relationship (i.e. the first X co-author at the
# first level, the first X co-author of any first degree coauthor at the
# second level and so on. This mean that at the ith degree the graph could
# have a max of Xi nodes
network.connection.nodestoshoweachlevel.default = 30

# you can override all the previous settings on a connection-type/level    # basis
#network.connection.coauthors.nodestoshoweachlevel.0 = 15
#network.connection.coauthors.nodestoshoweachlevel.1 = 10
#network.connection.interests.nodestoshoweachlevel.0 = 15
Limiting the number of nodes shown could produce some unexpected behavior. For example, if you limit the display to the first 10 top co-authors than, in the case that, the 11th co-author of the focus RP is also in the top ten list of co-authors for one or more 1st level co-author this 11th co-author will be show as 2nd level relationship. But, when the user click on it, the system will report that the relationship with the focus RP is a first level relationship and the strength of the relationship will be shown.
For some relationship it is useful introduce some limit also during the indexing phase for both performance and meaning reasons. Looking for co-keywords relationship including all the keywords used in any publication is a no sense because some keywords are really general and widely used. Look to these keywords will produce a network of all the RPs and external authors in the repository. A better strategy is to only assign a keyword to an RP or external author if these people have used the keyword more than other. We look for all the keywords used in the repository and we assign any keyword to the top X authors that use it.
# -1 works on all possible results, configurable on a relationship basis
network.connection.loader.limitnode.default = -1
network.connection.loader.limitnode.kwdpub = 50
This limitation could be applied to the co-interest, co-discipline, co-keywords in grant, etc. as well.
The batch script
org.dspace.app.cris.batch.ScriptIndexNetwork (you can use the –a option to elaborate any connection-type or –s <alias> to elaborate a single connection-type) is used to build a dedicated SOLR core where network information are pre-assembled.
The SOLR network core
The SOLR core used by the network visualization is defined as follow
network.server = http://localhost:8080/solr/network
In the network core a SOLR document represent a connection between two nodes (RP, external or department), the document includes the following fields:
connection-type: the network alias (coauthors, interests, etc.)
node A: text value, authority (rp key), rp department
node B: text value, authority (rp key), rp department
connection-value: the publication in common (co-authorship), the keyword (co-keywords), the interest (co-interest) etc.
focus: these fields (values, authority) are automatically copied from the node fields to get fast response to some queries
dept: this field contains the concatenation of the node A department and node B department field separated by a |||. It is used to get fast response to some queries
Network metrics
These metrics are currently stored as RP values that is not the optimal approach. The functionality should be revised in a future version to store the information using the new generic Metrics structure
For any network the system is able to calculate four metrics
Numbers of collaboration
Max strength of the collaboration in the network
Average strength of the collaboration network
Quadratic variance of the collaboration network
These metrics are calculated by the batch script:
org.dspace.app.cris.batch.ScriptMetricsNetwork –a [or –s <alias> for single connection mode]
These values are stored in the RP data so that, if desired, you can also show them in the public RP visualization
This feature requires that the following TextField exist in your RP configuration for each connection-type:
numberscollaboration_network_<connection-alias>;
maxstrengthcollaboration_network_<connection-alias>;
averagestrengthcollaboration_network_<connection-alias>;
quadraticvariancecollaboration_network_<connection-alias>