Contribute to the DSpace Development Fund
The newly established DSpace Development Fund supports the development of new features prioritized by DSpace Governance. For a list of planned features see the fund wiki page.
UNMAINTAINED. This documentation has been moved to the official DSpace documentation at COAR Notify - Dashboard
Introduction
To complement the developments for the COAR Notify protocol COAR Notify Documentation, the Notify Administrative Dashboard has been implemented to monitor the general usage of the COAR Notify protocol across the repository.
The dashboard is accessible to repository administrators only via the menu voice COAR Notify > Dashboard.

The dashboard is organised in three tabs:
Metrics
Logs/Inbound
Logs/Outbound
Dashboard tabs
Metrics
The “Metrics” tab displays data about usage of the COAR Notify protocol, showing the number of received (accepted/processed/failure/untrusted) and generated (delivered/queued/queued for retry/failure) LDNs, and the total number of items involved.

Any LDN Message is considered in this view as long as the Notification is stored.
Meaning of each box
Each box describes a different status the notifications are
Accepted
This box displays the number of LDN received as an acceptance to a previous request sent from the repository.
This means We have received an acceptance notification from the external service (Notice this is not the same as receiving the Review/Endorsement or any other object)
so the external service has accepted our previous notification an has replied with a confirmation to the LDN.
When an Acceptance LDN is received as reply to a previously sent notification this counter is increased.
Processed LDN
This box displays the number of LDN received and processed correctly (acceptance notifications are included as well since acceptance might be defined as a subset of processed notification)
Notifications in this status have been correctly processed and a corresponding action was triggered
Failure
This box displays the number of LDN received but not correctly processed.
This status includes QUEUE_STATUS_FAILED and QUEUE_STATUS_UNMAPPED_ACTION. So any failing notification is reported to be reviewed by the user
Untrusted
This box displays the number of LDN received but not even processed.
Any notification in this status has not even been evaluated since the Service was not recognized or the IP range was not respected
Delivered
This box displays the number of LDN Sent without any error.
Any notification successfully delivered will increase this counter
Queued
This box displays the number of LDN waiting to be sent (LDN is still queued)
Since LDN are not immediately sent to the external service this status is displaying how many items are still queued
Queued for retry
This box displays the number of LDN waiting for reprocessing
This means the failing (outgoing) notification has been re-queued to be reprocessed
Failure
This box displays the number of Failing LDN
Generally in this case the external service didn't receive the notification (an error code is expected when delivering the LDN)
Involved Items
These boxes are duplicated for each row for Incoming and Outgoing LDN.
They display the total number of items in the repository involved in the workflow process for COAR NOTIFY.
In few words these boxes display the number of items a LDN was receive/generated for
Boxes configuration
REST (Discovery configuration)
Each box is related to a different discovery configuration as mentioned above
- ldnMessageEntityBaseConfig is the "base" configuration for all the different LDN discovery config.
This configuration mainly defines the search filter and facets used by any discovery config. - NOTIFY.incoming.accepted is the configuration for the "Accepted" box
- NOTIFY.incoming.processed is the configuration for the "Processed LDN" box
- NOTIFY.incoming.failure is the configuration for the "Failure (for incoming)" box
- NOTIFY.incoming.untrusted is the configuration for the "Untrusted" box
- NOTIFY.incoming.involvedItems is the configuration for the "Involved items (for incoming)" box
- NOTIFY.outgoing.delivered is the configuration for the "Delivered" box
- NOTIFY.outgoing.queued is the configuration for the "Queued" box
- NOTIFY.outgoing.queued_for_retry is the configuration for the "Queued for retry" box
- NOTIFY.outgoing.failure is the configuration for the "Failure (for outgoing)" box
- NOTIFY.outgoing.involvedItems is the configuration for the "Involved items )for outgoing)" box
Angular
On the angular application we can decide which box has to be displayed, the text color, the background color and the title for each one
The angular configuration involved is found in default-app-config.ts
Here's an example of the angular configuration
notifyMetrics: AdminNotifyMetricsRow[] = [ { ........
......
|
|---|
The above layout configuration allows to configure the whole Dashboard/Metrics Tab
Using AdminNotifyMetricsRow we are allowed to define a custom number of rows (The default is two)
Each Row has title and boxes elements
- title is the title being displayed on the row
- boxes is the list of boxes in the current row
Each Box object has the following mandatory fields: color, title, config and description and one optional parameter textColor
- color is the background color for the box (as HEX color code)
- title is the text displayed on the box (as key for the label)
- config is the discovery configuration to use
- description is the tool-tip text displayed (as key for the label)
- textColor is the font color used for the title of the box (as HEX color code)
User Interface
Each colored box is clickable and behind each box there's a different discovery configuration:
Statuses Boxes will redirect the user to the corresponding log’s tab (either inbound or outbound), showing the LDN messages filtered by the corresponding selected criteria
Involved item boxes will redirect the user to the Administrative Search page, where only the involved items, either by incoming or outgoing LDN messages, will be shown in the results list.
Items can than be further filtered also for any COAR Notify metadata (notify.relation.endorsedBy, datacite.relation.isReviewedBy, and datacite.relation.isReferencedBy) using the facets.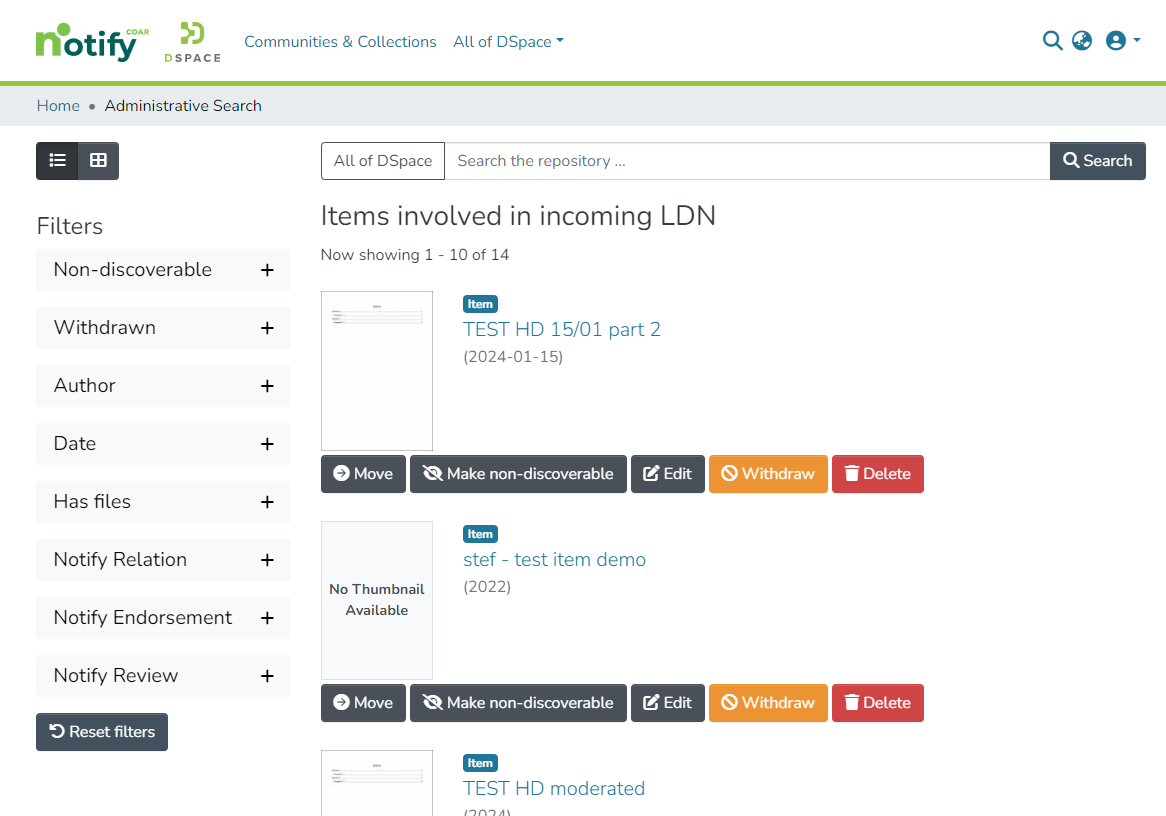
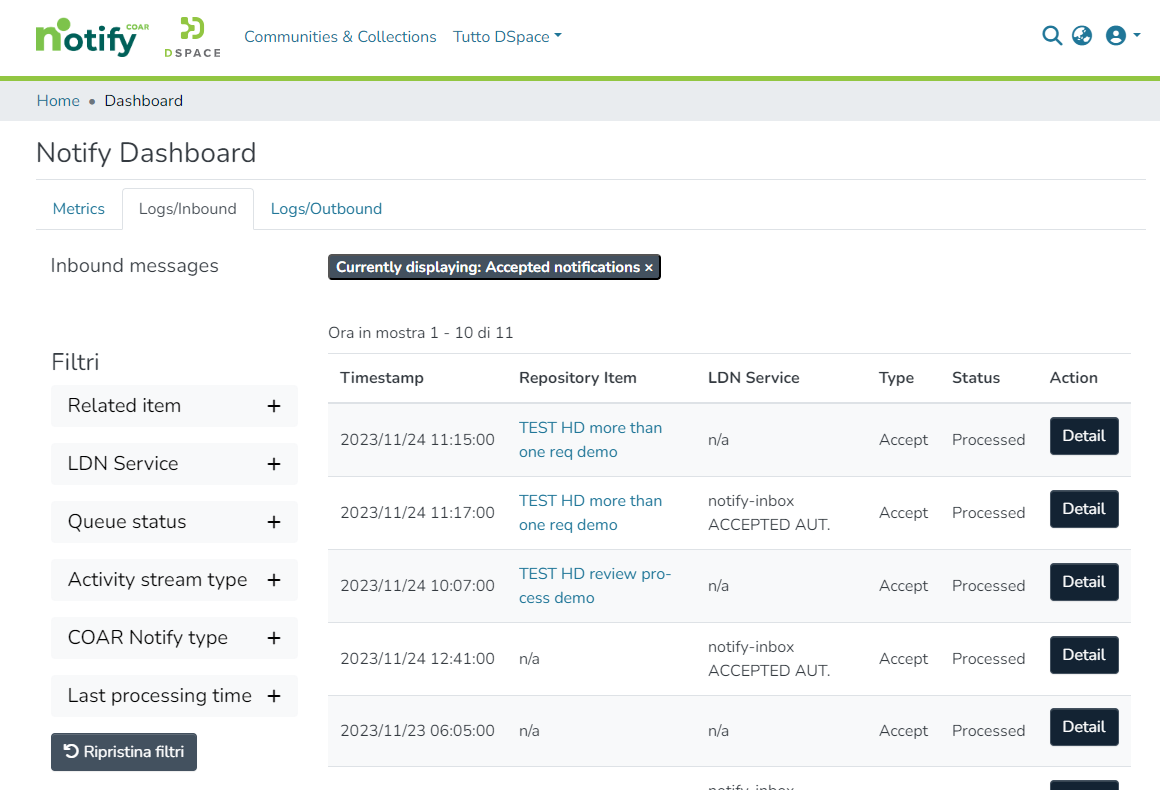
Logs Inbound Tab
In the “Logs/Inbound” tab it’s possible to search and check the individual status of each LDN message received by the repository.
Logs are listed in a table displaying the following columns:
Timestamp
Repository item
LDN Service
Type
Status
Action

Logs can be scrolled and/or filtered by:
Related item
LDN Service
Queue status
Activity stream type
COAR Notify type
Last processing time
In the logs' table, the value in the “Repository Item” column links to the involved item in the repository.
By clicking on the 'detail' button corresponding to each log, a modal will open displaying the technical information of the received LDN message
and it is also be possible to inspect the JSON notification which might be relevant for some purposes.

In case of messages with a queue status equal to “untrusted” and “unmapped action”, a second button ”Reprocess” will be displayed.
By clicking this button, a request to reprocess the LDN message is triggered.
This allows administrators to reprocess, for instance, messages received from LDN services that have not yet been registered (once the proper mapping has been added on the related spring config file),
or notification which hadn't been correctly processed the first time.
In case of deleted items, LDN services, etc., “n/a” will be shown in the logs' table in the corresponding "Repository Item" coloumn.
Logs with “Unmapped Action” status don’t display a timestamp, as they have not been processed.
Why a LDN notification should be reprocessed?
- The external service might have changed the IP and it doesn't match any longer with the rage provided on the LDN Service
- The LDN Notification had an unsupported type an this led to an unmapped action status.
In this case we should configure a new mapping for the missing type before reprocessing the notification
Logs Outbound Tab
In the “Logs/Outbound” tab it’s possible to search and check the individual status of each LDN message received by the repository.
Logs are listed in a table displaying the following columns:
Timestamp
Repository item
LDN Service
Type
Status
Action

Logs can be scrolled and/or filtered by:
Related item
LDN Service
Queue status
Activity stream type
COAR Notify type
Last processing time
In the logs' table, the value in the “Repository Item” column links to the involved item in the repository.
By clicking on the 'detail' button corresponding to each log, a modal will open displaying the technical information of the received LDN message
and it is also be possible to inspect the JSON notification which might be relevant for some purposes.

In case of messages with a queue status equal to “failed”, a second button ”Reprocess” will be displayed. By clicking this button, a request to reprocess the message is triggered.
This allows administrators to reprocess messages received from LDN services that have not yet been registered in the repository, or whose data (i.e. service URL and IP range) have not been correctly entered in the LDN service registry.
Why a LDN notification should be reprocessed?
- The Service was temporarily down at the moment the LDN notification was sent
- The Service changed the Inbox Url and the notification was not deliverable
In case of deleted items, LDN services, etc., “n/a” will be shown in the logs' table.
Logs with “Untrusted” status don’t display a timestamp, as they have not been processed.
Test Scenario
Accessing and browsing the COAR Notify Dashboard
Login as an Admin. A “COAR Notify > Dashboard” menu entry should be included in the administrative menu
After clicking on “Dashboard”, the landing page will display three tabs: Metrics, Logs/Inbound, and Logs/Outbound.
As a default, the Metrics tab will be displayed as landing page and it will displays the following statistics, grouped in colored boxes (Metrics tab):
Number of received LDNs split by Accepted, Processed, Failure, and Untrusted
Number of generated LDNs split by Delivered, Queued, Queued for retry, and Failure
The total number of items involved, distinguished by received and sent LDNs
Click on the “Accepted” box in the “Number of received LDN” section
The page will shift to the “Logs/Inbound” tab, with the table showing only messages with an Accepted status. The number of messages will match the number displayed in the Accepted box of the Metrics tab
Browse back to the Metrics tab
Click on the “Involved items” box in the “Number of received LDN” section
The user will be redirected to the Admin Search page, where only items involved in incoming LDN messages will be listed, and it will be possible to filter them by COAR Notify metadata, if any is present in an item
Browse back to the COAR Notify > Dashboard
Browse to the Logs/Inbound tab
The page will present a table listing the logs of all inbound LDN messages, with filters facets on the left side
Each log will have a corresponding button “Detail”, which will open a modal displaying the LDN message information and the related JSON payload
Logs with status “Failed” and “Unmapped Action” will display also a “Reprocess” button
Browse to the Logs/Outbound tab
The page will present a table listing the logs of all outbound LDN messages, with filters facets on the left side
Each log will have a corresponding button “Detail”, which will open a modal displaying the LDN message information and the related JSON payload
Logs with status “Failed” and “Untrusted” will display also a “Reprocess” button
Testing Processed LDN Box
Access the Metric tab in the COAR Notify Dashboard
Send a valid COAR LDN message from a TRUSTED source to the DSpace inbox
wait for the extractor to process the LDN
The number of processed LDNs should be increased by one
Testing UNTRUSTED LDN Box
Access the Metric tab in the COAR Notify Dashboard
Send a valid COAR LDN message from an UNTRUSTED source to the DSpace inbox
The number of LDN messages from UNTRUSTED source should be increased by one
Testing Failing LDN Box
Access the Metric tab in the COAR Notify Dashboard
Send a valid COAR LDN message from a TRUSTED source with an UNMAPPED action to the DSpace inbox related to a not existing DSpace item
The number of failing LDN messages should be increased by one
Testing Accepted LDN Box
- Access the Metric tab in the COAR Notify Dashboard
- Send a valid COAR LDN message to an external service
- The service should reply with an acceptance LDN
- The number of accepted notification should be increased by one
Testing Queued/Delivered LDN Box
- Submit an item and request a review from a registered LDN service (alternatively, submit an item in a collection for which the request review/endorsement/ingest to a set LDN service is handled automatically)
- Access the Metric tab in the COAR Notify Dashboard
The number of queued LDN should be increased by one
Wait for the extractor and refresh the page
The number of delivered LDN should be increased by one
Testing the Failure LDN Box
- Configure a service with an invalid inbox
- Submit an item and request a review for the registered service with the invalid inbox
- Wait for the extractor
- The number of Failure LDN should be increased by one
Testing Queued for retry LDN Box
This is quite hard to test. The test should be made against a webservice which is not working at the moment of the request and that eventually starts responding to the LDN requests
Testing Logs of all the outgoing LDN messages
Access the Logs/Outbound tab in the COAR Notify Dashboard
The page should lists all outbound LDN messages, paginated, sorted by date descending, with the possibility to filter by Related item, LDN Service, Queue status, Activity stream type, COAR Notify type, and Last processing time
Submit an item and request a review from a registered LDN service (alternatively, submit an item in a collection for which the request review/endorsement/ingest to a set LDN service is handled automatically)
Filter by the LDN service, selecting the LDN service target of the request review
Check that the logs include the messages sent to the selected LDN service
Filter by Related item, selecting the title of the submitted item
Check that the logs include the messages related to the submitted item
Testing Logs of all the incoming LDN messages
Access the Logs/Inbound tab in the COAR Notify Dashboard
The page should lists all inbound LDN messages, paginated, sorted by date descending, with the possibility to filter by Related item, LDN Service, Queue status, Activity stream type, COAR Notify type, and Last processing time
Submit an item and request a review from a registered LDN service (alternatively, submit an item in a collection for which the request review/endorsement/ingest to a set LDN service is handled automatically)
Emulate the Notify Service external system sending us an Announce Review LDN Message as described in COAR Notify Documentation#TestingAnnounceReviewagainstcurrentrepository
Wait up to 2 minutes and refresh the page
Filter by the LDN service, selecting the LDN service target of the request review
Check that the logs include the messages sent by the selected LDN service
Filter by Related item, selecting the title of the submitted item
Check that the logs include the messages related to the submitted item, including the simulated Announce Review message
Overview
Content Tools
All content on the LYRASIS Wiki is licensed under the CC BY (Attribution) license![]() , unless otherwise noted.
, unless otherwise noted.