Co-Authorship and Co-Investigator Network Visualizations
Prior to 1.8.1, co-authorship and co-investigator graphs were provided by a Flash based component, preventing anyone that doesn't have Flash installed - in particular, mobile devices - from viewing them.
In 1.8.1, a new way of rendering these visualizations has been included, however it is NOT offered by default when you upgrade an instance - you need to update the runtime.properties.
visualization.d3 = enabled
(Note that it is not currently possible to offer different visualizations based on the client - you will have to choose to have VIVO use either one style or the other)
Based on a Javascript library that generates svg markup (D3), it will render in any current browser - from IE9 onwards.
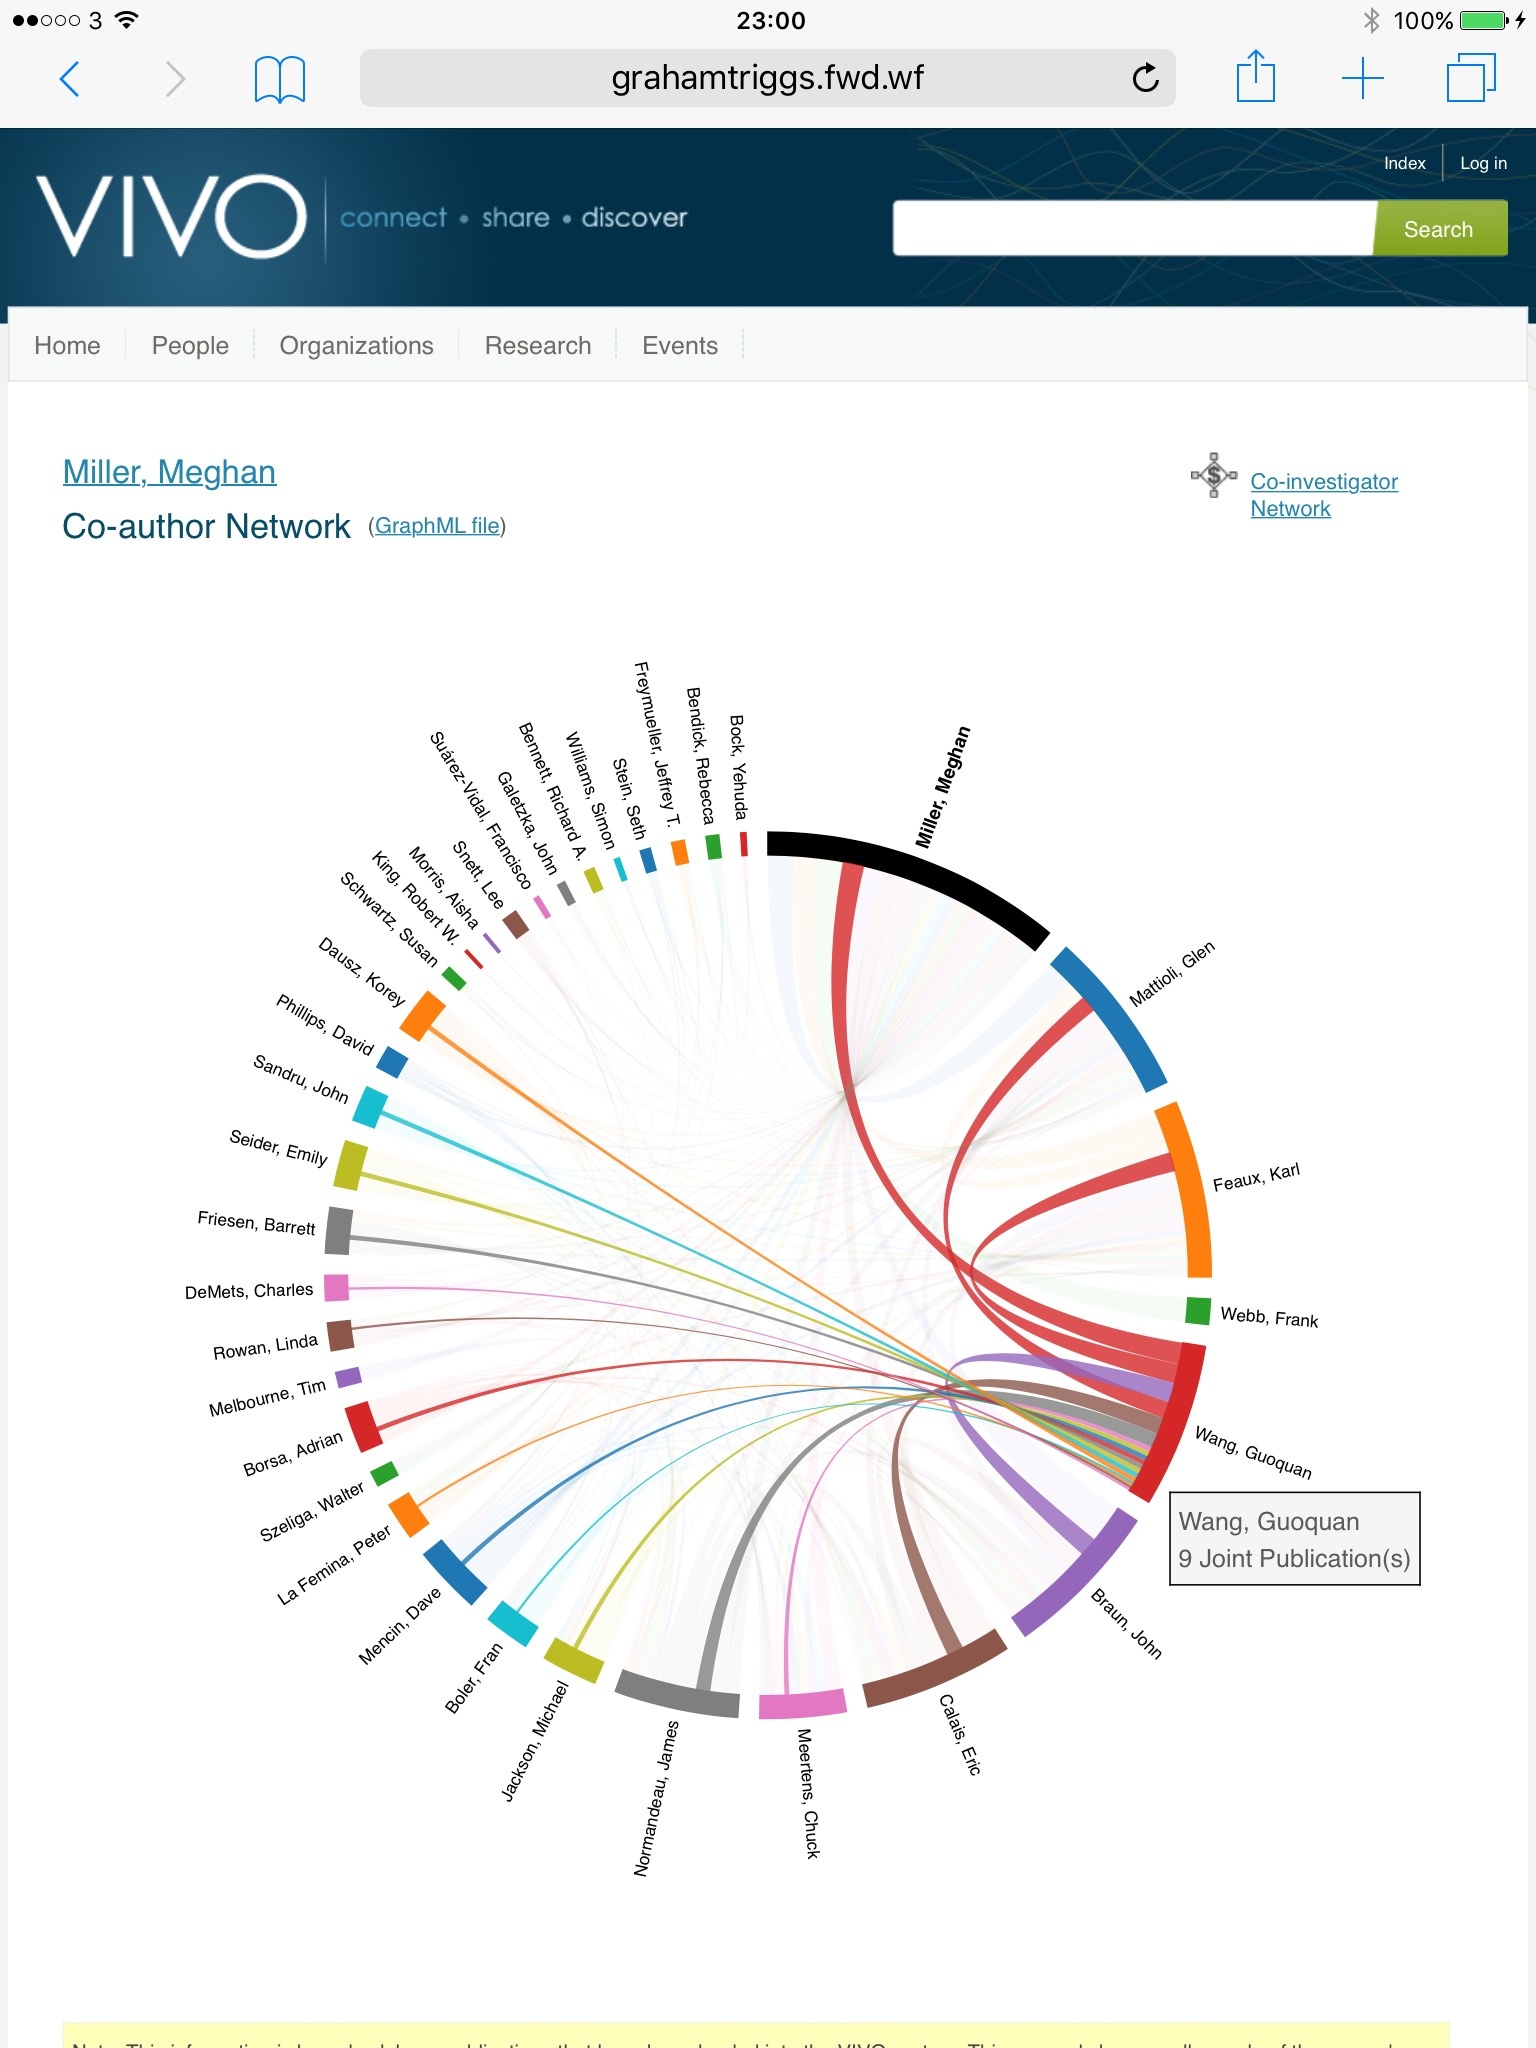
The visualization that has been implemented is also more colourful, and displays larger, as can be seen in the following examples:

Here is it working on an iPad: